📊 BTCUSDT Technical Analysis – 1-Hour Timeframe (Oct 5, 2025)
Created by FarshadRazaghi using TradingView
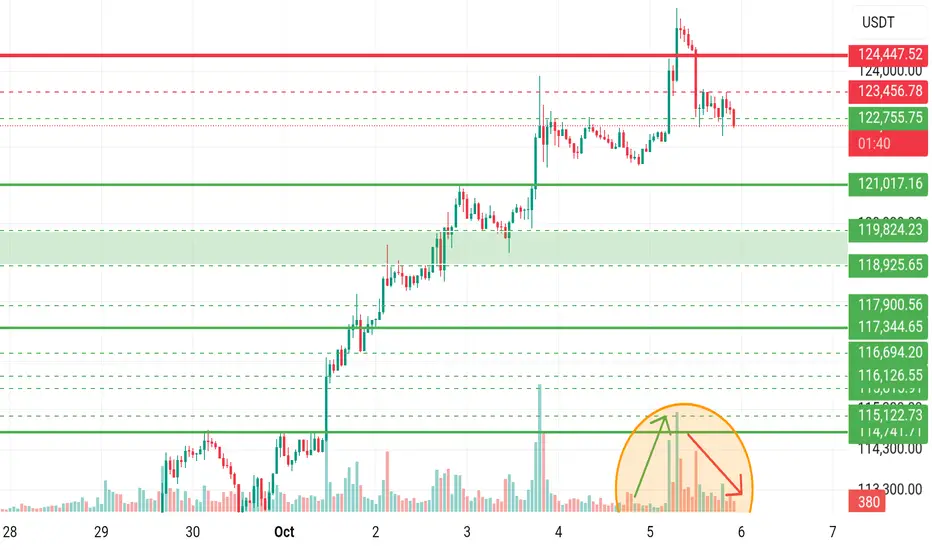
This 1-hour chart captures Bitcoin’s price action against Tether from September 29 to October 6. After a strong bullish rally reaching 124,447.32, BTC faced selling pressure and is now consolidating near the 121,017.16 support level.
🔻 Overall Trend
- From Sep 29 to Oct 5, BTC moved in a clear uptrend, breaking through multiple resistance zones.
- On Oct 5, price hit a peak at 124,447.32, followed by bearish candles and a noticeable drop in volume—indicating potential exhaustion.
🟩 Key Support Zones
- 119,824.23 and 118,925.65 have acted as strong support levels.
- If 121,017.16 fails to hold, price may decline toward 117,504.32 and possibly 115,122.73.
🟥 Resistance Zones
- The main resistance is at 123,456.78, which previously rejected upward momentum.
- A breakout above this level could lead to a retest of the 124,447.32 high.
📉 Volume Analysis
- A sharp drop in volume is observed near the top (highlighted in orange), suggesting weakening bullish momentum.
- Declining red volume bars may indicate a slow correction or sideways consolidation.
📈 Potential Scenarios
1. Bullish Case: Holding above 121K and breaking through 123,456 could trigger a move toward 124,447.
2. Bearish Case: Losing the 121K support may open the path to 119K and then 117K.
---
🧠 Conclusion:
BTCUSDT is at a critical decision point. Price behavior around the 121K support and 123K resistance will likely define the next move. Traders should monitor volume closely and wait for confirmation before entering positions. Risk management remains essential.
Created by FarshadRazaghi using TradingView
This 1-hour chart captures Bitcoin’s price action against Tether from September 29 to October 6. After a strong bullish rally reaching 124,447.32, BTC faced selling pressure and is now consolidating near the 121,017.16 support level.
🔻 Overall Trend
- From Sep 29 to Oct 5, BTC moved in a clear uptrend, breaking through multiple resistance zones.
- On Oct 5, price hit a peak at 124,447.32, followed by bearish candles and a noticeable drop in volume—indicating potential exhaustion.
🟩 Key Support Zones
- 119,824.23 and 118,925.65 have acted as strong support levels.
- If 121,017.16 fails to hold, price may decline toward 117,504.32 and possibly 115,122.73.
🟥 Resistance Zones
- The main resistance is at 123,456.78, which previously rejected upward momentum.
- A breakout above this level could lead to a retest of the 124,447.32 high.
📉 Volume Analysis
- A sharp drop in volume is observed near the top (highlighted in orange), suggesting weakening bullish momentum.
- Declining red volume bars may indicate a slow correction or sideways consolidation.
📈 Potential Scenarios
1. Bullish Case: Holding above 121K and breaking through 123,456 could trigger a move toward 124,447.
2. Bearish Case: Losing the 121K support may open the path to 119K and then 117K.
---
🧠 Conclusion:
BTCUSDT is at a critical decision point. Price behavior around the 121K support and 123K resistance will likely define the next move. Traders should monitor volume closely and wait for confirmation before entering positions. Risk management remains essential.
Penafian
Maklumat dan penerbitan adalah tidak dimaksudkan untuk menjadi, dan tidak membentuk, nasihat untuk kewangan, pelaburan, perdagangan dan jenis-jenis lain atau cadangan yang dibekalkan atau disahkan oleh TradingView. Baca dengan lebih lanjut di Terma Penggunaan.
Penafian
Maklumat dan penerbitan adalah tidak dimaksudkan untuk menjadi, dan tidak membentuk, nasihat untuk kewangan, pelaburan, perdagangan dan jenis-jenis lain atau cadangan yang dibekalkan atau disahkan oleh TradingView. Baca dengan lebih lanjut di Terma Penggunaan.