### **Step 1: Entry**
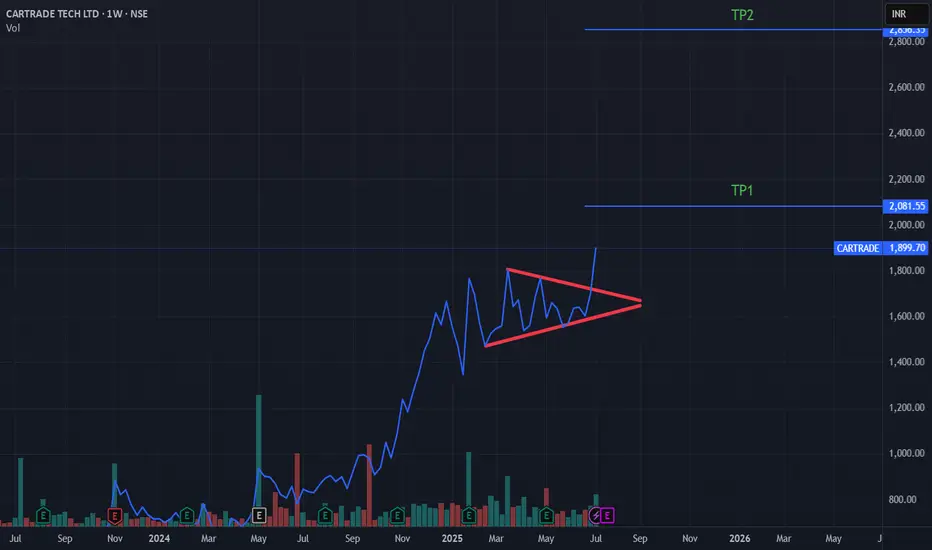
The chart shows a bullish breakout from a symmetrical triangle pattern. The entry signal was triggered when the price decisively closed above the upper trendline of this triangle. An entry can be considered around the current price of **₹1,899.70** or on a potential retest of the breakout zone (approximately ₹1,750 - ₹1,800).
### **Step 2: Stop Loss**
To manage risk, a stop loss should be placed below a key support level. A logical placement would be below the lower trendline of the triangle pattern to protect against a failed breakout. A suitable stop loss could be set near **₹1,600**.
### **Step 3: Take Profit**
The chart has two pre-defined targets based on the breakout's momentum:
* **Target 1 (TP1):** ₹2,081.55
* **Target 2 (TP2):** ₹2,856.35
You could consider booking partial profits at TP1 and trailing the stop loss for the remaining position towards TP2.
Penafian
Maklumat dan penerbitan adalah tidak dimaksudkan untuk menjadi, dan tidak membentuk, nasihat untuk kewangan, pelaburan, perdagangan dan jenis-jenis lain atau cadangan yang dibekalkan atau disahkan oleh TradingView. Baca dengan lebih lanjut di Terma Penggunaan.
Penafian
Maklumat dan penerbitan adalah tidak dimaksudkan untuk menjadi, dan tidak membentuk, nasihat untuk kewangan, pelaburan, perdagangan dan jenis-jenis lain atau cadangan yang dibekalkan atau disahkan oleh TradingView. Baca dengan lebih lanjut di Terma Penggunaan.