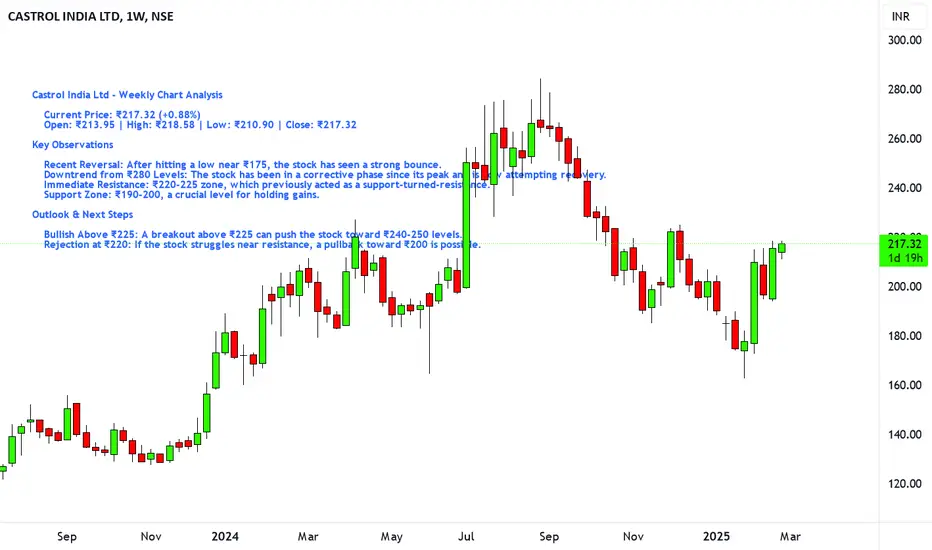
Castrol India Ltd - Weekly Chart Analysis
Current Price: ₹217.32 (+0.88%)
Open: ₹213.95 | High: ₹218.58 | Low: ₹210.90 | Close: ₹217.32
Key Observations
Recent Reversal: After hitting a low near ₹175, the stock has seen a strong bounce.
Downtrend from ₹280 Levels: The stock has been in a corrective phase since its peak and is now attempting recovery.
Immediate Resistance: ₹220-225 zone, which previously acted as a support-turned-resistance.
Support Zone: ₹190-200, a crucial level for holding gains.
Outlook & Next Steps
Bullish Above ₹225: A breakout above ₹225 can push the stock toward ₹240-250 levels.
Rejection at ₹220: If the stock struggles near resistance, a pullback toward ₹200 is possible.
Automated Tools/Indicators/Screeners available at kkonline.org/nimblrta
Penafian
Maklumat dan penerbitan adalah tidak dimaksudkan untuk menjadi, dan tidak membentuk, nasihat untuk kewangan, pelaburan, perdagangan dan jenis-jenis lain atau cadangan yang dibekalkan atau disahkan oleh TradingView. Baca dengan lebih lanjut di Terma Penggunaan.