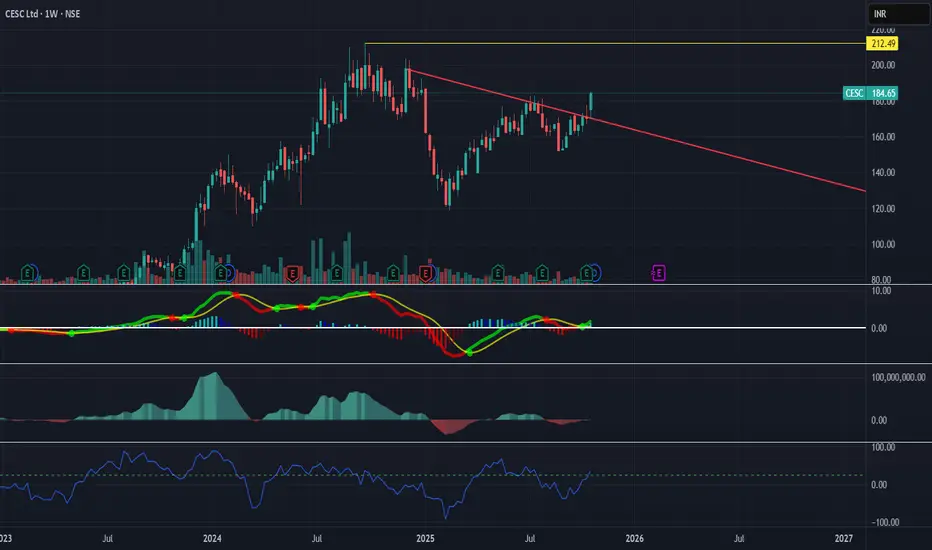
⚡ CESC LTD – Trendline Breakout on Weekly Chart
Chart Type: Weekly (1W)
CMP: ₹184.65
Breakout Zone: ₹180–₹185
Next Target: ₹212
Support Zone: ₹165–₹170
📊 Technical View:
CESC has broken out of a long-term falling trendline with strong bullish candles and volume pickup.
MACD bullish crossover confirms trend reversal momentum.
RSI turning upward from mid-level supports renewed strength.
Sustained close above ₹185 will confirm a structural breakout after long consolidation.
🎯 Trade Plan
Action Level Comment
Entry ₹185–₹188 On weekly close above ₹185
Stoploss ₹165 Below recent swing low
Target 1 ₹200 First resistance zone
Target 2 ₹212 Positional target
Target 3 ₹235+ If momentum sustains
⚙️ Setup Type:
✅ Positional / Swing Trade
⏰ Holding Period: 4–6 Weeks
📈 Risk–Reward: ~1:2
🔮 Arthavidhi View:
CESC has ended its downtrend and is entering a new bullish phase with confirmation from MACD and RSI. Power sector momentum may further fuel this move toward ₹212+. Watch weekly close above ₹185 for confirmation
Penafian
Maklumat dan penerbitan adalah tidak dimaksudkan untuk menjadi, dan tidak membentuk, nasihat untuk kewangan, pelaburan, perdagangan dan jenis-jenis lain atau cadangan yang dibekalkan atau disahkan oleh TradingView. Baca dengan lebih lanjut di Terma Penggunaan.
Penafian
Maklumat dan penerbitan adalah tidak dimaksudkan untuk menjadi, dan tidak membentuk, nasihat untuk kewangan, pelaburan, perdagangan dan jenis-jenis lain atau cadangan yang dibekalkan atau disahkan oleh TradingView. Baca dengan lebih lanjut di Terma Penggunaan.