1. Trend Structure
The stock is currently in a bullish market structure, as confirmed by the recent break above the last Higher High (HH).
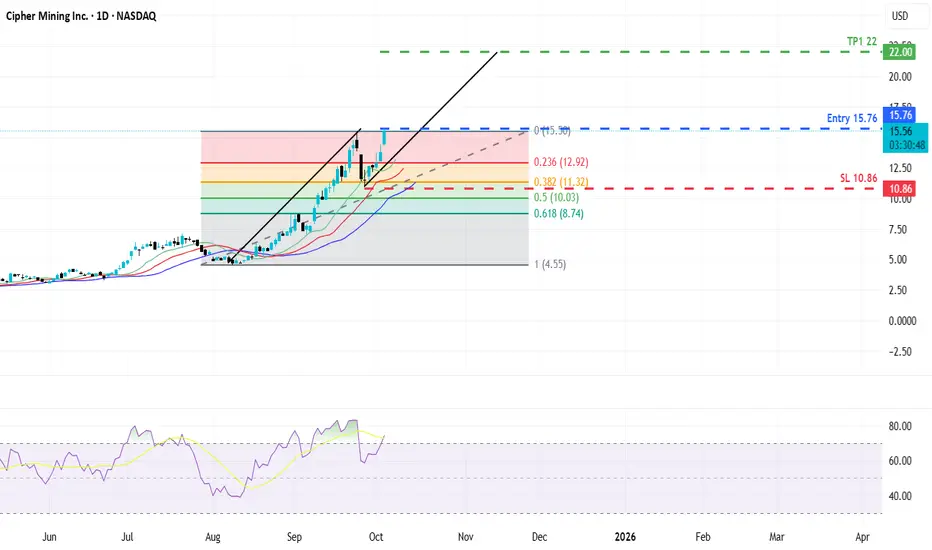
Before this breakout, the price retraced neatly to the 0.382 Fibonacci level at 10.86, respecting the shallow retracement zone typical of strong bullish trends.
This indicates strong buyers’ presence and confirms that the correction phase is complete.
2. Fibonacci Confluence
Swing Low to Swing High: The 0.382 retracement level around 10.86 acted as a demand zone.
Price not only respected this level but also used it as a springboard for continuation, increasing the probability that the bullish leg is sustainable.
The fact that the stock broke past the last higher high post retracement strengthens the continuation thesis.
3. AB=CD Harmonic Projection
The ABCD pattern is playing out, and the completion zone projects a target at 22.00.
Harmonic traders often consider this a measured move extension, aligning with Fibonacci expansion levels (typically the 1.272 or 1.618 extension of the prior swing).
This level coincides with the next psychological resistance area, making it a valid target.
4. Trade Setup
Entry: Current Market Price (CMP) at 15.76
Stop Loss: Below 10.86 (0.382 Fib retracement / last HL). Conservative traders may keep a tighter SL just under the recent HL instead of the full fib retracement to optimize risk.
Target Price: 22.00 (ABCD projection completion zone).
The stock is currently in a bullish market structure, as confirmed by the recent break above the last Higher High (HH).
Before this breakout, the price retraced neatly to the 0.382 Fibonacci level at 10.86, respecting the shallow retracement zone typical of strong bullish trends.
This indicates strong buyers’ presence and confirms that the correction phase is complete.
2. Fibonacci Confluence
Swing Low to Swing High: The 0.382 retracement level around 10.86 acted as a demand zone.
Price not only respected this level but also used it as a springboard for continuation, increasing the probability that the bullish leg is sustainable.
The fact that the stock broke past the last higher high post retracement strengthens the continuation thesis.
3. AB=CD Harmonic Projection
The ABCD pattern is playing out, and the completion zone projects a target at 22.00.
Harmonic traders often consider this a measured move extension, aligning with Fibonacci expansion levels (typically the 1.272 or 1.618 extension of the prior swing).
This level coincides with the next psychological resistance area, making it a valid target.
4. Trade Setup
Entry: Current Market Price (CMP) at 15.76
Stop Loss: Below 10.86 (0.382 Fib retracement / last HL). Conservative traders may keep a tighter SL just under the recent HL instead of the full fib retracement to optimize risk.
Target Price: 22.00 (ABCD projection completion zone).
Penafian
Maklumat dan penerbitan adalah tidak dimaksudkan untuk menjadi, dan tidak membentuk, nasihat untuk kewangan, pelaburan, perdagangan dan jenis-jenis lain atau cadangan yang dibekalkan atau disahkan oleh TradingView. Baca dengan lebih lanjut di Terma Penggunaan.
Penafian
Maklumat dan penerbitan adalah tidak dimaksudkan untuk menjadi, dan tidak membentuk, nasihat untuk kewangan, pelaburan, perdagangan dan jenis-jenis lain atau cadangan yang dibekalkan atau disahkan oleh TradingView. Baca dengan lebih lanjut di Terma Penggunaan.