The weekly chart of CL shows a divergence of MACD lines and sort of a divergence of the histogram. Both Force Indexes are lower than they were at the last swing high. 
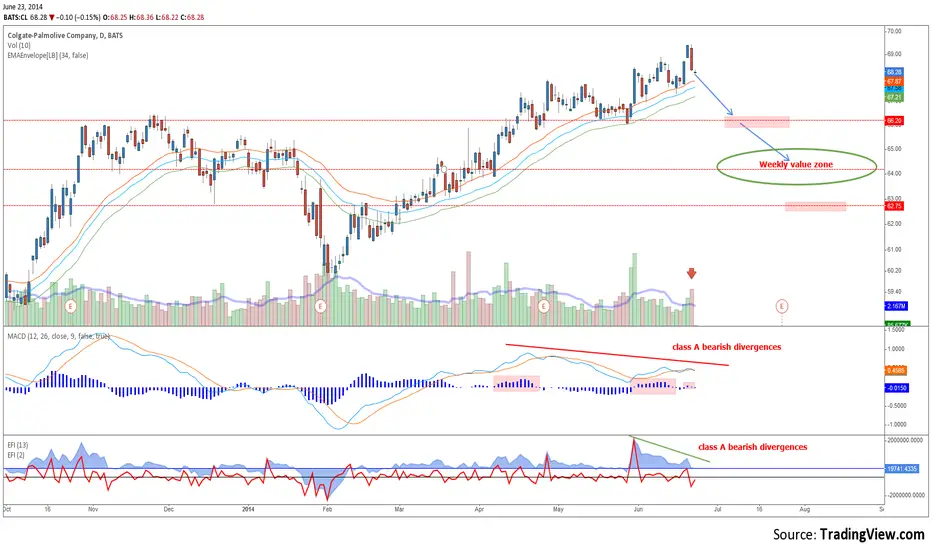
The daily chart has a closing marubozu candle, which might signal the start of the correction, note also the high volume. MACD lines and histogram show a class A bearish divergence, and so do both Force Indexes. First support comes at 66$. There is good support at 64$, where the weekly Wave stands approximately. That will be a level to watch closely if this correction is coming
The daily chart has a closing marubozu candle, which might signal the start of the correction, note also the high volume. MACD lines and histogram show a class A bearish divergence, and so do both Force Indexes. First support comes at 66$. There is good support at 64$, where the weekly Wave stands approximately. That will be a level to watch closely if this correction is coming
Penafian
Maklumat dan penerbitan adalah tidak bertujuan, dan tidak membentuk, nasihat atau cadangan kewangan, pelaburan, dagangan atau jenis lain yang diberikan atau disahkan oleh TradingView. Baca lebih dalam Terma Penggunaan.
Penafian
Maklumat dan penerbitan adalah tidak bertujuan, dan tidak membentuk, nasihat atau cadangan kewangan, pelaburan, dagangan atau jenis lain yang diberikan atau disahkan oleh TradingView. Baca lebih dalam Terma Penggunaan.