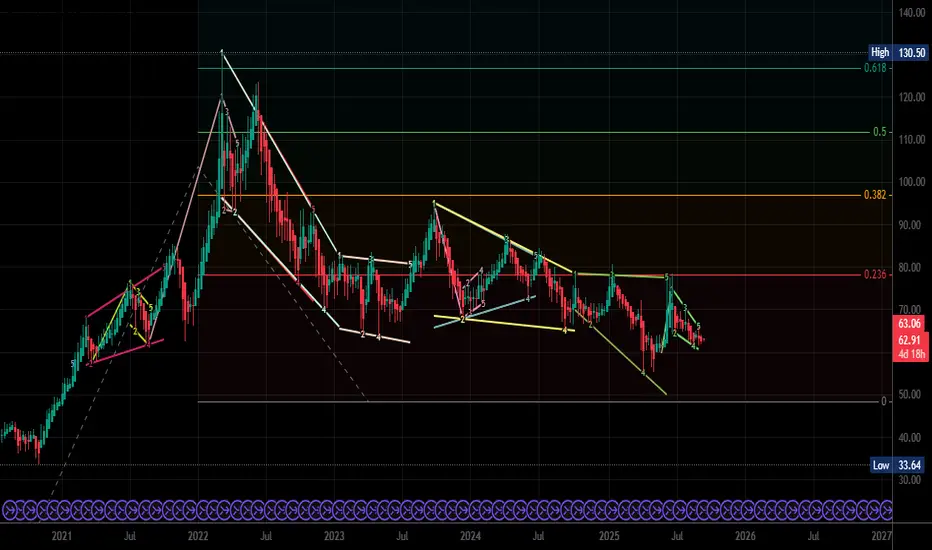
CL1! Weekly — Is today the buy day?
Bullish flag on the weekly, daily CVD higher-low divergence, and a possible monthly 45° (Gann 1×1) reclaim. I’m exploring the long case and mapping what needs to happen.
What I think I’m seeing
Structure: Weekly bull flag compressing under 63.3–64.5.
Flow: Daily CVD made a higher low while price made equal/lower lows → buyers absorbing at the base.
Angle: Price is testing the monthly Gann 1×1 (45°). Reclaim/hold tends to start an advance toward the next fan angles.
Gann breakdown
Horizontal (price resonance)
Trigger band: 63.30–63.40
Guardrails above: 63.56 / 63.63 → 64.24 → 64.49 (convert to support = go mode)
Upside ladder once 64.49 holds: 66.27 → 67.76 → 72.90 → 79.90 → 86.57 → 92.15
Vertical (time)
Watching weekly windows from the last swing low: ~13 / 21 / 34 / 52 weeks (Gann & Fib counts). If a push through 63s–64s aligns with one of these, I’ll weight it higher.
Angle (fan)
A monthly close back above the 1×1 (45°) often points to a rotation toward the 1×2 / 2×1 fans—which line up with the ~66–68 → 72–73 areas on my chart.
Long plan (step-by-step)
Trigger: Push through 63.30–63.40 with CVD printing a higher high versus the prior 2 sessions.
Confirmation steps:
Hold above 63.56 / 63.63
Then 64.24
Promotion to “trend-up” when the daily/4H close > 64.49 and it holds on retest.
Entries (staged):
Buy stop 63.36–63.44
Add on strength 63.58–63.63
Add on successful retest 64.24–64.49
Risk (tight, mechanical):
Initial stop 62.74 (beneath the 0.618/CVD pivot).
After a hold above 64.49, trail under prior day’s low or a rising 1-hr VWAP/EMA.
Targets / scale-outs:
63.97 → 64.49 (convert)
66.27 (first major take-profit)
67.76 (second)
Leave a runner toward 72.90 if the monthly 45° is reclaimed and respected.
Live checklist I’ll monitor
CVD: higher highs on each push through 63.3 / 63.6
VWAP: intraday VWAP rising and respected on dips
Closes: daily/4H > 64.49 and a weekly that keeps 64s as support
Angle: monthly candle tracking above the 45°
I’m treating this as a long setup that needs confirmation: let the tape prove it through 63s → 64.49, then walk the ladder 66.27 → 67.76 → 72.90 with disciplined risk.
Penafian
Maklumat dan penerbitan adalah tidak dimaksudkan untuk menjadi, dan tidak membentuk, nasihat untuk kewangan, pelaburan, perdagangan dan jenis-jenis lain atau cadangan yang dibekalkan atau disahkan oleh TradingView. Baca dengan lebih lanjut di Terma Penggunaan.
Penafian
Maklumat dan penerbitan adalah tidak dimaksudkan untuk menjadi, dan tidak membentuk, nasihat untuk kewangan, pelaburan, perdagangan dan jenis-jenis lain atau cadangan yang dibekalkan atau disahkan oleh TradingView. Baca dengan lebih lanjut di Terma Penggunaan.