Hello Traders,
Oil is at a true crossroads, testing whether the bull thesis shall be ruled correct.
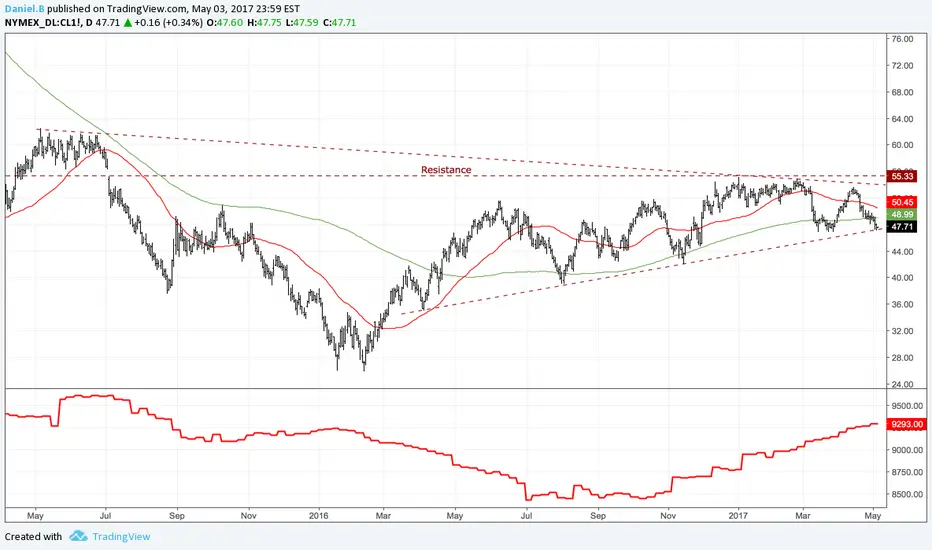
We have had a daily close below the 200ma and as P.T.J says,“One principle for sure would be: get out of anything that falls below the 200-day moving average.”
With that being said, oil has tested the uptrend multiple times and we are seeing some weakness across commodity markets as a whole. We are awaiting longer term short positions to trigger when all our filters are met, oil being one of them.
If I was looking to enter bullish then oil would have to close above YTD resistance at $55. That seems an unlikely scenario, but if oil can manage a close above there even though the fundamental narrative does not align then that is a clear display of momentum being skewed to the upside and we are long for a short period. For any bullish positioning on a break higher the immediate resistance level to monitor would be $60.
If we break lower and out of the triangle then I would be more inclined to short with some key support areas where I will shave some of the position off. Key support areas: $37-$39, $26, anything after $26 then I just hold on to the trend until it stops and reverses thus trailing me out of a position.
Please see the linked "related ideas" for some more info or proxy to the oil trade which has already begun. I also tend to update thoughts and technical analysis more often on my twitter page. Feel free to follow me: https://twitter.com/DannyB_NYC
Weekly Bar Chart: Wedge Continuation?

Oil is at a true crossroads, testing whether the bull thesis shall be ruled correct.
We have had a daily close below the 200ma and as P.T.J says,“One principle for sure would be: get out of anything that falls below the 200-day moving average.”
With that being said, oil has tested the uptrend multiple times and we are seeing some weakness across commodity markets as a whole. We are awaiting longer term short positions to trigger when all our filters are met, oil being one of them.
If I was looking to enter bullish then oil would have to close above YTD resistance at $55. That seems an unlikely scenario, but if oil can manage a close above there even though the fundamental narrative does not align then that is a clear display of momentum being skewed to the upside and we are long for a short period. For any bullish positioning on a break higher the immediate resistance level to monitor would be $60.
If we break lower and out of the triangle then I would be more inclined to short with some key support areas where I will shave some of the position off. Key support areas: $37-$39, $26, anything after $26 then I just hold on to the trend until it stops and reverses thus trailing me out of a position.
Please see the linked "related ideas" for some more info or proxy to the oil trade which has already begun. I also tend to update thoughts and technical analysis more often on my twitter page. Feel free to follow me: https://twitter.com/DannyB_NYC
Weekly Bar Chart: Wedge Continuation?
Dagangan aktif
Triggered into a short position.Trade smart, and with a plan.
Nota
Current Fibonacci Levels *Daily Bars*Still trading well below Daily 200ma = Bearish Bias.
Penerbitan berkaitan
Penafian
Maklumat dan penerbitan adalah tidak bertujuan, dan tidak membentuk, nasihat atau cadangan kewangan, pelaburan, dagangan atau jenis lain yang diberikan atau disahkan oleh TradingView. Baca lebih dalam Terma Penggunaan.
Penerbitan berkaitan
Penafian
Maklumat dan penerbitan adalah tidak bertujuan, dan tidak membentuk, nasihat atau cadangan kewangan, pelaburan, dagangan atau jenis lain yang diberikan atau disahkan oleh TradingView. Baca lebih dalam Terma Penggunaan.