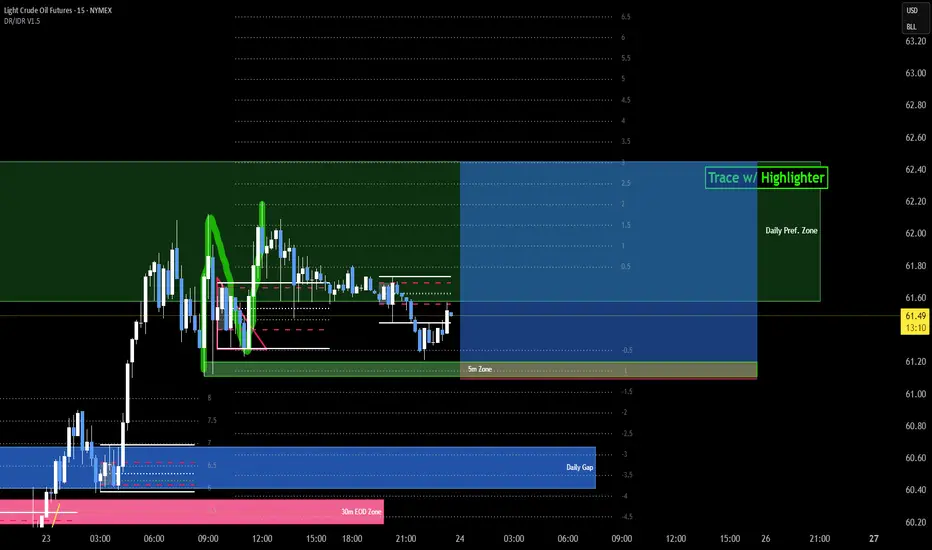
Important to Highlight the price action to show where exactly the new high is (tp), where is the liquidity that should be just above the zone, and the source of the move (the zone using the 5 minute chart).
I look for the last "doji" before the move that closed in the opposite direction.
So, in this idea, the zone is based on the last down doji candle before the up move.
And for longs, I mark the zone starting at the Open of the doji candle and down to the lowest point of that doji wick.
I look for the last "doji" before the move that closed in the opposite direction.
So, in this idea, the zone is based on the last down doji candle before the up move.
And for longs, I mark the zone starting at the Open of the doji candle and down to the lowest point of that doji wick.
Penafian
Maklumat dan penerbitan adalah tidak dimaksudkan untuk menjadi, dan tidak membentuk, nasihat untuk kewangan, pelaburan, perdagangan dan jenis-jenis lain atau cadangan yang dibekalkan atau disahkan oleh TradingView. Baca dengan lebih lanjut di Terma Penggunaan.
Penafian
Maklumat dan penerbitan adalah tidak dimaksudkan untuk menjadi, dan tidak membentuk, nasihat untuk kewangan, pelaburan, perdagangan dan jenis-jenis lain atau cadangan yang dibekalkan atau disahkan oleh TradingView. Baca dengan lebih lanjut di Terma Penggunaan.