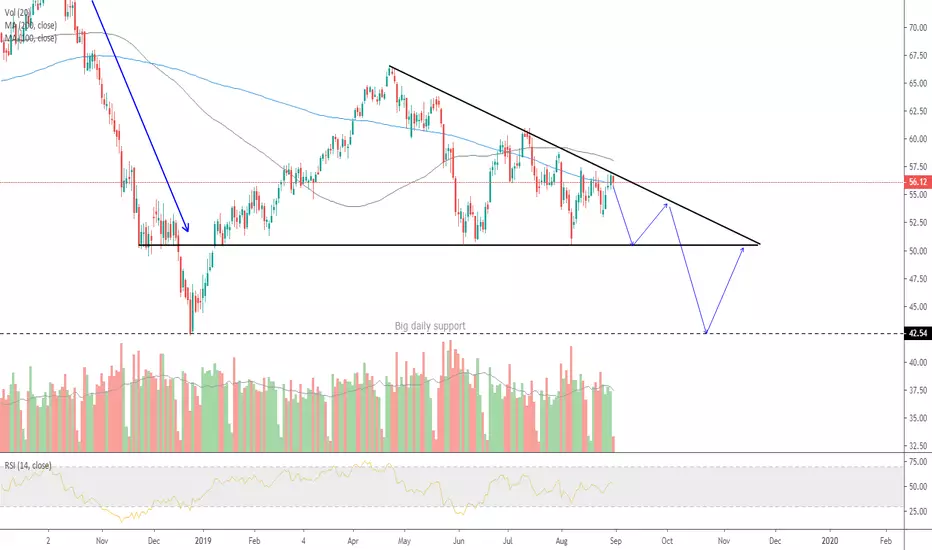
Daily /CL is showing a descending triangle that looks to be close to a breakout. If it breaks to the downside, I think it will retest a major daily support level that dates back to 2015 (noted via the dashed line at bottom).
Fundamentally, oil is at the mercy of geopolitical issues. Right now there is a lot of uncertainty between the U.S.A. and Iran. Iran controls the Strait of Hormuz, and about a third of the world's oil passes through there. But, the U.S.A. is becoming a big time oil player, so the need for Hormuz is in question (I think). In addition to the Iran stuff going on, there's also the trade war and worries of a contracting economy - both of which are bearish for oil for a multitude of reasons, mostly demand.
If a break to the downside happens, I will most likely go short. However, because of the fundamental uncertainties and how reliant oil is on geopolitical issues, I will keep my stop losses pretty tight. I will try to play it down to at least the major daily support level, and then possibly look for a bounce-off entry to retest the bottom of the triangle.
Penafian
Maklumat dan penerbitan adalah tidak dimaksudkan untuk menjadi, dan tidak membentuk, nasihat untuk kewangan, pelaburan, perdagangan dan jenis-jenis lain atau cadangan yang dibekalkan atau disahkan oleh TradingView. Baca dengan lebih lanjut di Terma Penggunaan.
Penafian
Maklumat dan penerbitan adalah tidak dimaksudkan untuk menjadi, dan tidak membentuk, nasihat untuk kewangan, pelaburan, perdagangan dan jenis-jenis lain atau cadangan yang dibekalkan atau disahkan oleh TradingView. Baca dengan lebih lanjut di Terma Penggunaan.
