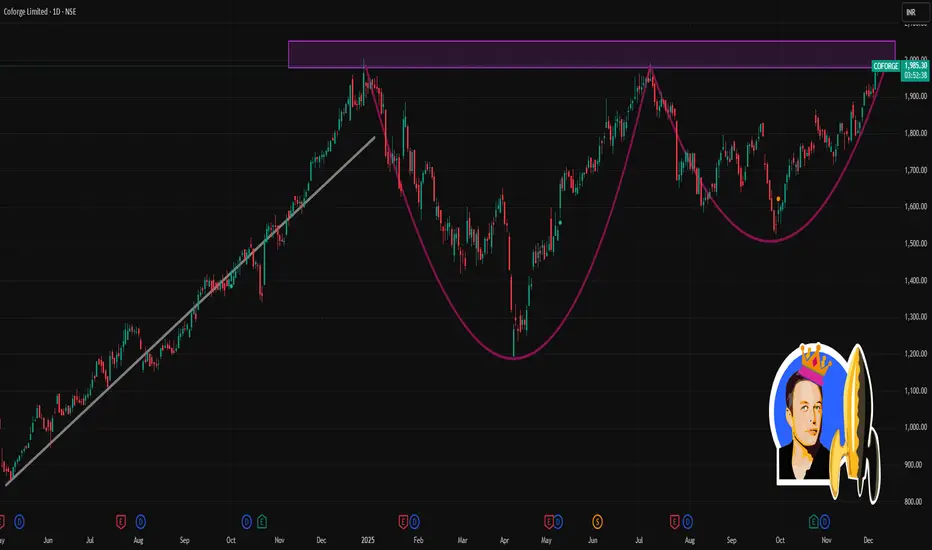
📈 Current Price & Range (as on recent close)
Last traded price: ~ ₹1,966.20
Day’s low–high: ~ ₹1,917.80 – ₹1,986.00
🧭 Key Moving‑Average & Technical Context
On daily chart, short‑ and medium‑term SMAs/EMAs (5‑, 10‑, 20‑, 50‑, 100‑, 200‑day) are all in “outperform” configuration — indicating bullish bias.
Other indicators on daily chart — RSI, MACD, Stochastic, ROC, CCI etc — are also showing strength (many in “outperform” zone).
⚠️ What to Monitor / What Can Happen
If Coforge breaks above ~₹1,986 with good volume — could extend higher, possibly retesting upper ranges near ₹2,000 (52‑week highs ~₹2,005).
If price falls below ~₹1,915 and fails to hold, next support zones around ~₹1,900 — and if that breaks, ~₹1,840‑₹1,850 becomes the important cushion.
Given strong moving‑average alignment plus bullish oscillator values, trend bias remains upward — but day‑to‑day volatility can still cause swings, so intraday trades should use tight stop‑loss.
Penerbitan berkaitan
Penafian
Maklumat dan penerbitan adalah tidak bertujuan, dan tidak membentuk, nasihat atau cadangan kewangan, pelaburan, dagangan atau jenis lain yang diberikan atau disahkan oleh TradingView. Baca lebih dalam Terma Penggunaan.
Penerbitan berkaitan
Penafian
Maklumat dan penerbitan adalah tidak bertujuan, dan tidak membentuk, nasihat atau cadangan kewangan, pelaburan, dagangan atau jenis lain yang diberikan atau disahkan oleh TradingView. Baca lebih dalam Terma Penggunaan.