1. Technical Structure & Overall Trend
The price has recently broken out of lower lows and experienced a strong upward movement.
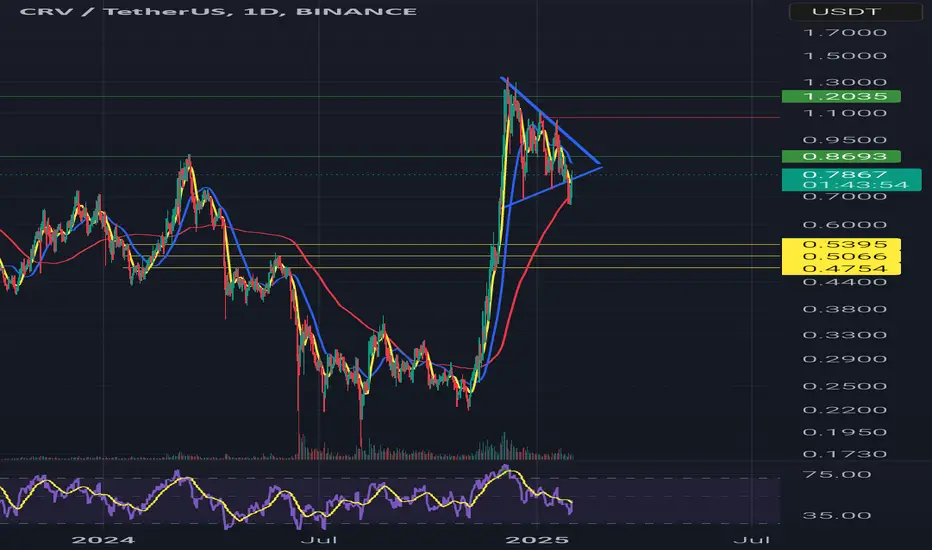
Currently, it is forming a symmetrical triangle pattern, indicating price compression and a potential breakout in either direction.
Moving averages are sloping upwards, suggesting a mid-term bullish trend.
Key support levels are at 0.5395, 0.5066, and 0.4754 USDT.
Major resistance levels are at 0.8693 and 1.2035 USDT.
2. Potential Trade Scenarios
✅ Bullish Scenario (Breakout to the Upside)
If the price breaks above the upper trendline of the triangle with strong volume, it could move towards 0.8693, and further towards 1.2035.
Entry: After a breakout confirmation and price stabilization above the resistance.
Stop-loss: Below the last low of the pattern (e.g., 0.70 or 0.68 depending on the breakout).
❌ Bearish Scenario (Breakdown to the Downside)
If the price breaks below the lower support of the triangle, it could retrace towards the 0.5395 and 0.5066 support zones.
Entry: After a confirmed breakdown and price stabilization below support.
Stop-loss: Above the lost support level (e.g., 0.80 or 0.82).
3. Entry Strategy & Risk Management
Conservative Entry: Wait for a breakout confirmation with a solid candle close.
Risk-to-Reward Ratio: A minimum of 2:1 is recommended for a reasonable trade.
Stop-loss & Take-profit: Set according to the chosen scenario.
Risk Management: Maintain a 1% risk per trade in line with your trading strategy.
Conclusion
The triangle pattern is nearing completion, and a breakout in the coming days is highly likely. It is recommended to wait for a decisive breakout in either direction before entering a trade.
Penafian
Maklumat dan penerbitan adalah tidak dimaksudkan untuk menjadi, dan tidak membentuk, nasihat untuk kewangan, pelaburan, perdagangan dan jenis-jenis lain atau cadangan yang dibekalkan atau disahkan oleh TradingView. Baca dengan lebih lanjut di Terma Penggunaan.
Penafian
Maklumat dan penerbitan adalah tidak dimaksudkan untuk menjadi, dan tidak membentuk, nasihat untuk kewangan, pelaburan, perdagangan dan jenis-jenis lain atau cadangan yang dibekalkan atau disahkan oleh TradingView. Baca dengan lebih lanjut di Terma Penggunaan.