Panjang
Cortex (CTXC) - Bullish divergence

** Risky, low market capital $40m **
Happy with the risk? Then read on..
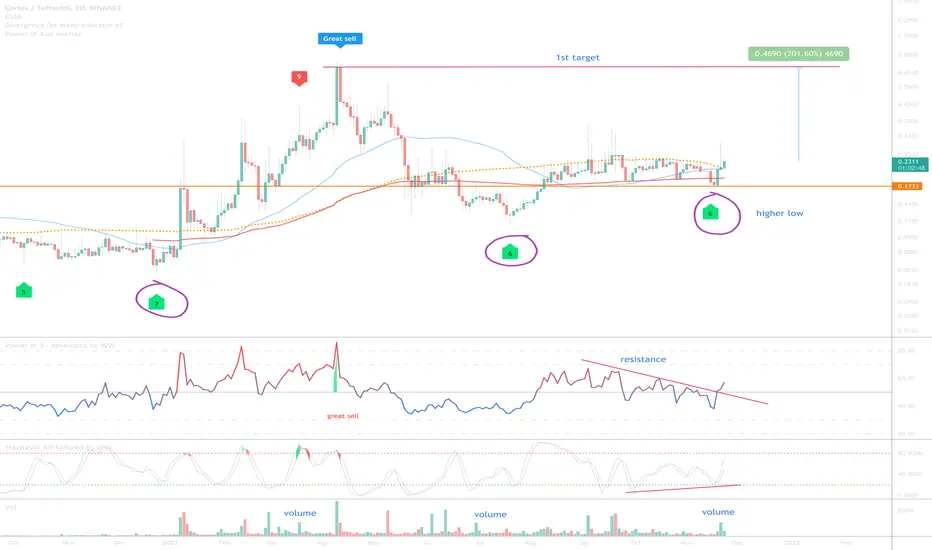
On the above 2-day chart price action has corrected an astonishing 80% since early April. A number of reasons now exist to be bullish, including:
1) Price action prints a higher low on past resistance. Look left.
2) Regular bullish divergence. Six oscillators (purple circles) are currently printing bullish divergence with price action. Look left!
3) Volume. I know not what or why but volume has been pouring into this low market project over the year. Someone knows something I don’t, follow the money.
4) The 6-day CTXC / BTC chart (below).
4a) “Incredible buy” signal is printed with following higher low.
4b) Price action breaks out of 3.3 years of resistance!
4c) 8 oscillators are currently printing regular bullish divergence with price action. On this time scale that’s huge.
Is it possible price action falls further? Sure.
Is it probable? Unlikely.
Good luck!
WW
6-day CTXC/BTC chart
Dagangan aktif
Support on past resistance confirmed.Dagangan aktif
Dagangan aktif
Dagangan aktif
BTC
bc1q2eckdzh0q8vsd7swcc8et6ze7s99khhxyl7zwy
Weblink: patreon.com/withoutworries
Allow 3-6 months on ideas. Not investment advice. DYOR
bc1q2eckdzh0q8vsd7swcc8et6ze7s99khhxyl7zwy
Weblink: patreon.com/withoutworries
Allow 3-6 months on ideas. Not investment advice. DYOR
Penafian
Maklumat dan penerbitan adalah tidak dimaksudkan untuk menjadi, dan tidak membentuk, nasihat untuk kewangan, pelaburan, perdagangan dan jenis-jenis lain atau cadangan yang dibekalkan atau disahkan oleh TradingView. Baca dengan lebih lanjut di Terma Penggunaan.