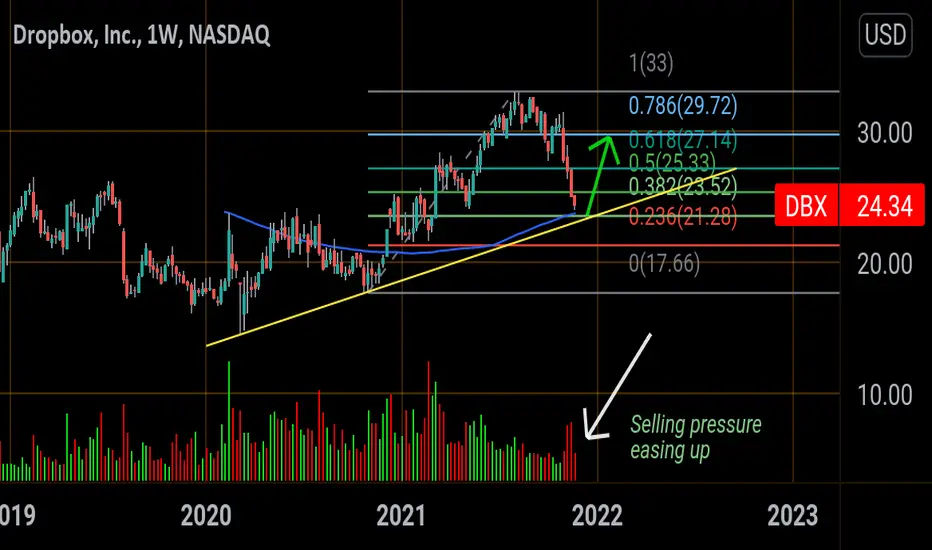
Fibonacci support level - 23.52
Weekly 100sma (Blue line )-23.70
Primary Trendline (Yellow line) - 23.20
Down more than 25% since its 52week high made back in August, A considerable correction here. Look for a bounce in the 23.50 area here with a bullish candle close. If support holds we should be headed back to new 52week high's.
If it closes below 22$ then we must likely will be heading back to 17$ which would represent a 50% drop in this stock from August highs (Crash).
Penerbitan berkaitan
Penafian
Maklumat dan penerbitan adalah tidak dimaksudkan untuk menjadi, dan tidak membentuk, nasihat untuk kewangan, pelaburan, perdagangan dan jenis-jenis lain atau cadangan yang dibekalkan atau disahkan oleh TradingView. Baca dengan lebih lanjut di Terma Penggunaan.
Penerbitan berkaitan
Penafian
Maklumat dan penerbitan adalah tidak dimaksudkan untuk menjadi, dan tidak membentuk, nasihat untuk kewangan, pelaburan, perdagangan dan jenis-jenis lain atau cadangan yang dibekalkan atau disahkan oleh TradingView. Baca dengan lebih lanjut di Terma Penggunaan.