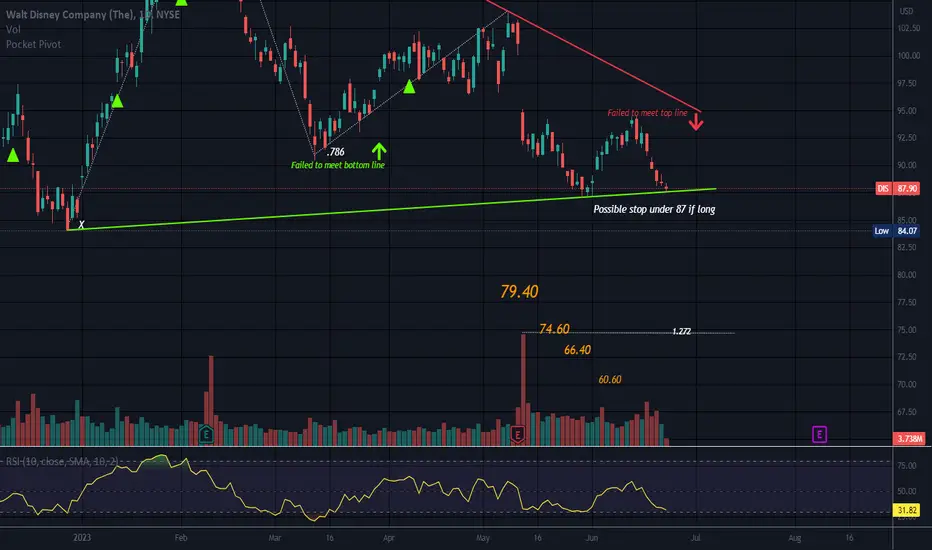
Price is at the support line of a large triangle.
The last leg failed to meet the top line which can be a negative indicator if one relies more on price action than indicators.
All triangles are neutral until broken with a trend in that direction. Some would say 2 closes below the line. But the market can do somersaults and make you feel like you need to go back to the drawing board )o:
Spinning top/Doji representing indecision at a support level. Time will tell.
This market as of late makes me question myself on a regular basis but all we can do is make an educated guess,
No recommendation. Possible M pattern with the 2nd leg reaching the .786 of the 1st leg up.
Penafian
Maklumat dan penerbitan adalah tidak dimaksudkan untuk menjadi, dan tidak membentuk, nasihat untuk kewangan, pelaburan, perdagangan dan jenis-jenis lain atau cadangan yang dibekalkan atau disahkan oleh TradingView. Baca dengan lebih lanjut di Terma Penggunaan.
Penafian
Maklumat dan penerbitan adalah tidak dimaksudkan untuk menjadi, dan tidak membentuk, nasihat untuk kewangan, pelaburan, perdagangan dan jenis-jenis lain atau cadangan yang dibekalkan atau disahkan oleh TradingView. Baca dengan lebih lanjut di Terma Penggunaan.