📊 Chart Context & Market Maker Concept Breakdown
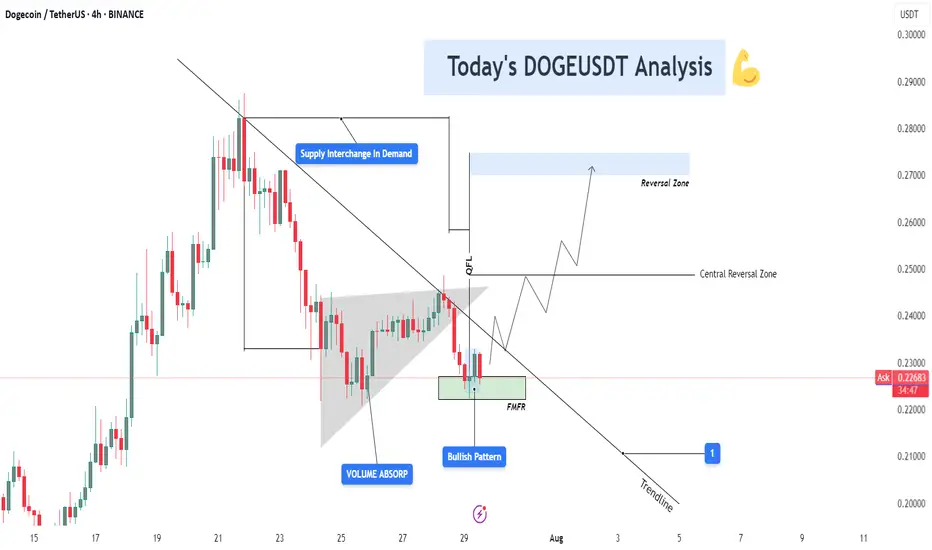
DOGEUSDT on the 4H timeframe is setting up for a potential trend reversal, following a structured retracement into a strong demand zone that aligns with multiple smart money confirmations: QFL base, trendline break, volume absorption, and FMFR (Final Move Final Reaction). Let’s dive into the technical layers of this setup:
🔻 1. Downtrend Phase & Structure Setup
After peaking near $0.29, DOGE entered a controlled downtrend, respecting a descending trendline and forming a consistent lower-high structure.
Each rejection from the trendline reflects institutional distribution, gradually pushing price into lower demand levels where value buyers can step in.
🔄 2. Supply Flips into Demand (S/D Flip Zone)
A key level near $0.225 – $0.230 initially acted as a supply zone — but following QFL logic and smart money reaccumulation, it is now showing signs of demand activation.
The chart highlights “Supply Interchange in Demand”, which means that this zone has been repurposed — from distribution to accumulation — another MMC footprint.
📌 Interpretation: This is where large players flip their position bias and start loading for the next leg up.
🔵 3. Volume Absorption Confirmed
Prior to the current bounce, a strong volume absorption phase was detected within a falling wedge or triangular base, shown on the chart.
Despite sell-side pressure, buyers continued to absorb orders — a sign that selling is weakening, and accumulation is underway.
📌 Clue: Volume absorption often precedes an explosive breakout, especially when aligned with FMFR or QFL patterns.
🔁 4. Final Move Final Reaction (FMFR)
Price tapped into the green box zone one final time, marked as FMFR (Final Move Final Reaction) — a key MMC reversal signal.
This occurs when market makers fake a breakdown (creating panic) and then sharply reverse, trapping breakout sellers and scooping up liquidity.
A small bullish candle formation (Bullish Engulfing / Pin Bar) can be seen within this zone — the “Bullish Pattern” label marks this.
🧠 Smart Money Logic: Institutions want liquidity. FMFR fakes weakness to attract retail shorts, then reverses to ride liquidity to the upside.
🔗 5. QFL Base + Break of Structure Setup
A QFL (Quick Flip Level) pattern is forming. This represents a market structure flip, where price first drops from a base, reclaims it later, and continues in the opposite direction.
Breaking this base and confirming above it would mark a true reversal in structure.
🛠️ Technical Confluences at Work
Element Insight
🔹 QFL Structure Base level reclaim in play (structure shift)
🔹 Volume Absorption Smart money soaking up sell pressure
🔹 FMFR Reaction Final stop hunt before the rally begins
🔹 S/D Flip Supply turned to demand near $0.225 zone
🔹 Bullish Pattern Early confirmation of reversal
📈 Projection Path & Reversal Zones
Two projected zones are mapped for price behavior:
🔸 Central Reversal Zone (~$0.250):
First significant resistance where price may pause or react.
Ideal partial profit level or re-entry after pullback.
🔹 Main Reversal Zone (~$0.270–0.275):
Target area for a full liquidity sweep.
This was a previous high-volume supply zone.
If price reaches here, expect potential rejection or distribution unless momentum is strong.
🎯 Trade Setup Strategy (Based on Your Chart)
Entry Area: $0.225 – $0.229 (FMFR Reversal Zone)
Stop-Loss: Below $0.221 (beneath FMFR low)
Take Profit 1: $0.250 (central zone)
Take Profit 2: $0.270 – $0.275 (main reversal zone)
📐 Risk-to-Reward:
TP1: 1:2
TP2: 1:3+ depending on entry timing
🧠 Psychology Behind the Setup
This DOGE setup is engineered to trap emotional traders:
Retail sellers enter late near the bottom.
Smart money waits at FMFR zone, absorbing liquidity.
Volume builds quietly.
Market reverses explosively, catching retail off guard.
By recognizing this setup early, you’re aligned with Market Makers, not against them.
Penerbitan berkaitan
Penafian
Maklumat dan penerbitan adalah tidak dimaksudkan untuk menjadi, dan tidak membentuk, nasihat untuk kewangan, pelaburan, perdagangan dan jenis-jenis lain atau cadangan yang dibekalkan atau disahkan oleh TradingView. Baca dengan lebih lanjut di Terma Penggunaan.
Penerbitan berkaitan
Penafian
Maklumat dan penerbitan adalah tidak dimaksudkan untuk menjadi, dan tidak membentuk, nasihat untuk kewangan, pelaburan, perdagangan dan jenis-jenis lain atau cadangan yang dibekalkan atau disahkan oleh TradingView. Baca dengan lebih lanjut di Terma Penggunaan.