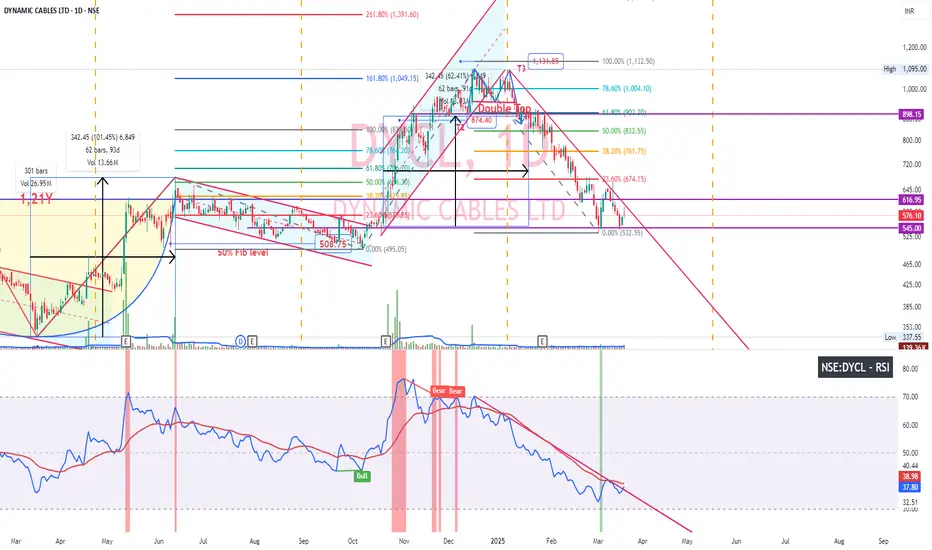
DYCL Dynamic cables daily chart. After exiting parallel channel, DYCL made double top formation and fell 41% breaking down neckline during Jan-Mar '25 correction despite good Q3 result YoY.
Now Daily chart displaying double bottom formation in price chart and RSI.
Mar 18 shows bullish harami and Mar 19 shows inverted hammer. Bullish patterns in daily chart. So far volume isn't satisfactory. May 17 (this week) Weekly chart shows hammer pattern, but RSI is taking nose dive. Let's see if daily chart makes the weekly chart better in upcoming days.
Considering demand in cables, DYCL is a good bet. I don't think recent entry of big player (Ultratech cement) to cable industry would affect much atleast for next year.
Dagangan aktif
DYCL Dynamic Cables blockbuster result both QoQ, YoY. Hits Upper Circuit yesterday and today 10% up. Nota
2 weeks consolidation taking support at 38.2% fib level btw Apr 7 '25 - Jul 11 '25. Added yesterday. Today 15+% upPenerbitan berkaitan
Penafian
Maklumat dan penerbitan adalah tidak bertujuan, dan tidak membentuk, nasihat atau cadangan kewangan, pelaburan, dagangan atau jenis lain yang diberikan atau disahkan oleh TradingView. Baca lebih dalam Terma Penggunaan.
Penerbitan berkaitan
Penafian
Maklumat dan penerbitan adalah tidak bertujuan, dan tidak membentuk, nasihat atau cadangan kewangan, pelaburan, dagangan atau jenis lain yang diberikan atau disahkan oleh TradingView. Baca lebih dalam Terma Penggunaan.