Panjang
EOS/USDT – Double Bottom Formation Signals Potential 200% Upside
hi Traders
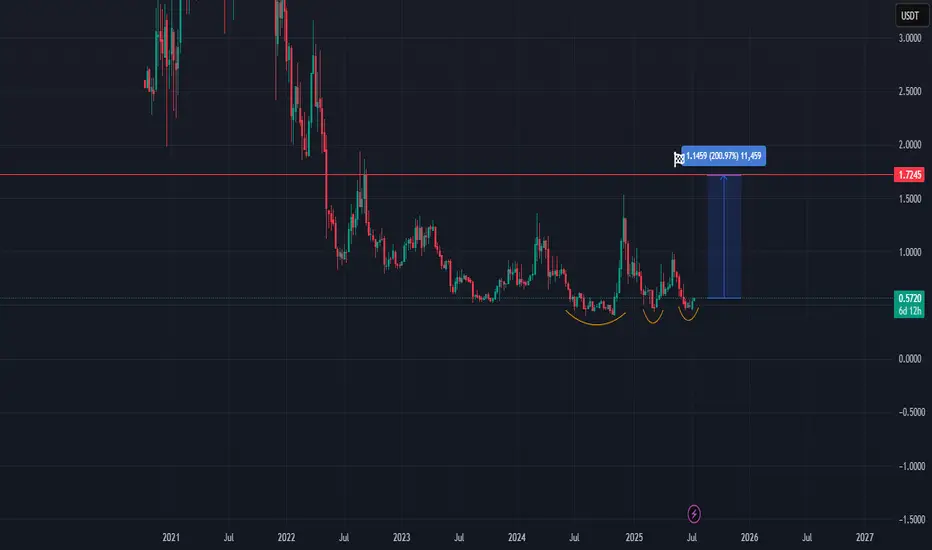
The EOS/USDT chart is currently showing a classic double bottom pattern, a strong bullish reversal signal typically seen after prolonged downtrends. This formation is evident with two distinct troughs forming near the $0.50–$0.55 range, followed by a recent price uptick indicating the start of a potential breakout.
The projected target for this breakout is around $1.72, which represents a 200% increase from the current level of approximately $0.57. This target aligns with a key horizontal resistance level from previous market structure.
If bullish momentum continues and volume supports the move, EOS could revisit this critical resistance zone in the coming weeks, making this a potential high-reward setup for traders eyeing a medium-term opportunity.
It may take some time but the patience will be rewarded!
💥 Free signals and ideas ➡ t.me/vfinvestment
Penafian
Maklumat dan penerbitan adalah tidak dimaksudkan untuk menjadi, dan tidak membentuk, nasihat untuk kewangan, pelaburan, perdagangan dan jenis-jenis lain atau cadangan yang dibekalkan atau disahkan oleh TradingView. Baca dengan lebih lanjut di Terma Penggunaan.