Telah dikemas kini
ERDUSDT: Which chart pattern are we in ?
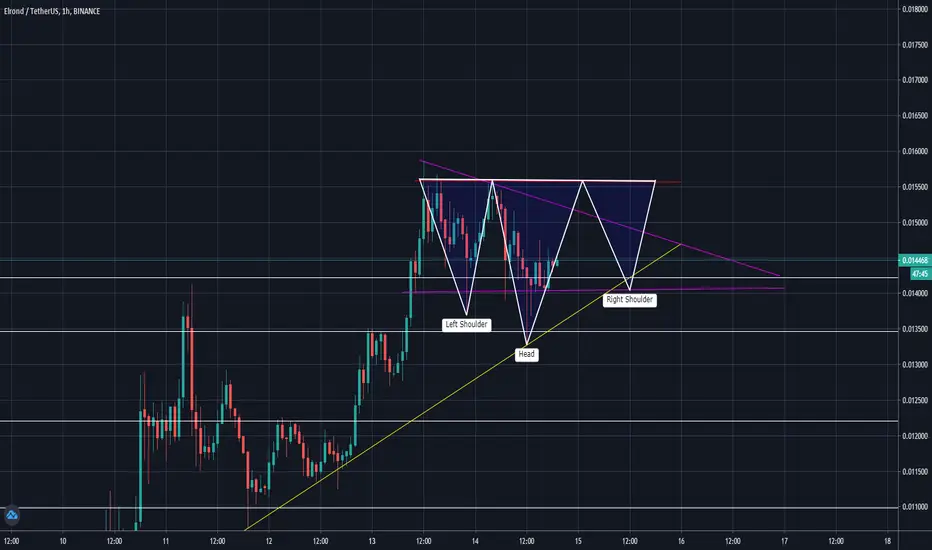
1. Inverse head and shoulders
2. Descending triangle
3. ???
Let me know what YOU think !
2. Descending triangle
3. ???
Let me know what YOU think !
Nota
So after the bottom of the head we did not hit to our neckline drawn here. This means :
*Pink resistance line could be our new neckline so inverse head and shoulders is tilted a bit to right.
*OR we are in a descending triangle really. (we can make sure of it when we hit to pink support line and jump back from it.
either case, we can profit off of these probable chart patterns.
Nota
seems like our descending triangle is broken, as well as inverse H&S for pink res. line. Either case very low volume currently, makes me think bulls are not in complete control. Can return into pink support line any time and can break it too. sorry but this price action is not a breakout for beforementioned chart patterns. no LONG position until I see a high volume big candle.Nota
So this was an descending triangle and it broke up. Also in 30min TF, retest of the resistance line is done.
I missed the entry but happy for those who entered after reading this analysis.
Don't forget to subscribe for more content.
Dagangan aktif
Nota
some take profit levels.Penafian
Maklumat dan penerbitan adalah tidak dimaksudkan untuk menjadi, dan tidak membentuk, nasihat untuk kewangan, pelaburan, perdagangan dan jenis-jenis lain atau cadangan yang dibekalkan atau disahkan oleh TradingView. Baca dengan lebih lanjut di Terma Penggunaan.
Penafian
Maklumat dan penerbitan adalah tidak dimaksudkan untuk menjadi, dan tidak membentuk, nasihat untuk kewangan, pelaburan, perdagangan dan jenis-jenis lain atau cadangan yang dibekalkan atau disahkan oleh TradingView. Baca dengan lebih lanjut di Terma Penggunaan.