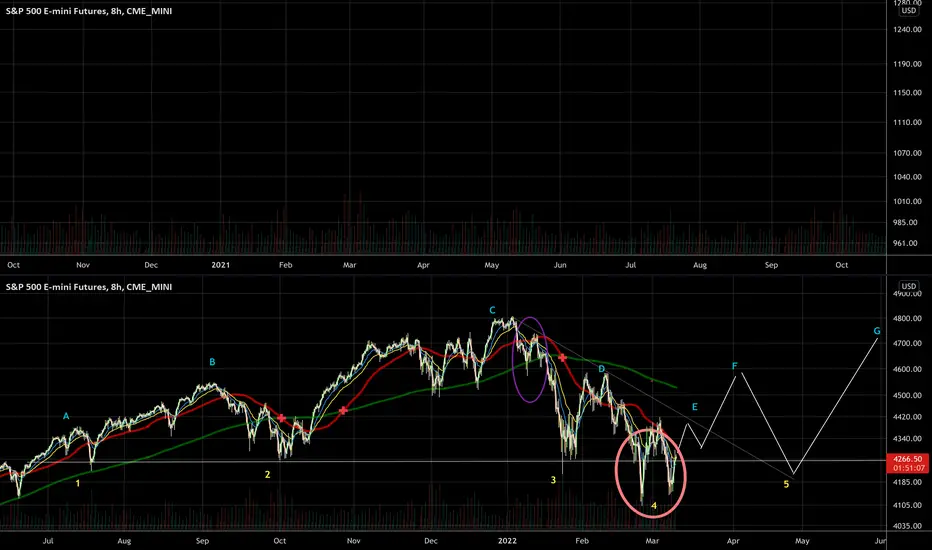
Mirroring the correction of 2010. The structure is almost similar with minor difference witch is totally normal since we can’t repeat exactly what happen in the past. Both of corrections came from rallying from a massive dump, the 2008 crash and 2020 Covid crash.Even the 200 and 50 MA average are doing exactly the same thing.
It will be interesting to see if price action will continue mirroring 2010 correction.
This analysis has started with checking the weekly chart RSI and try to find similar condition of a dump with the RSI price action .
It will be interesting to see if price action will continue mirroring 2010 correction.
This analysis has started with checking the weekly chart RSI and try to find similar condition of a dump with the RSI price action .
Penafian
Maklumat dan penerbitan adalah tidak dimaksudkan untuk menjadi, dan tidak membentuk, nasihat untuk kewangan, pelaburan, perdagangan dan jenis-jenis lain atau cadangan yang dibekalkan atau disahkan oleh TradingView. Baca dengan lebih lanjut di Terma Penggunaan.
Penafian
Maklumat dan penerbitan adalah tidak dimaksudkan untuk menjadi, dan tidak membentuk, nasihat untuk kewangan, pelaburan, perdagangan dan jenis-jenis lain atau cadangan yang dibekalkan atau disahkan oleh TradingView. Baca dengan lebih lanjut di Terma Penggunaan.