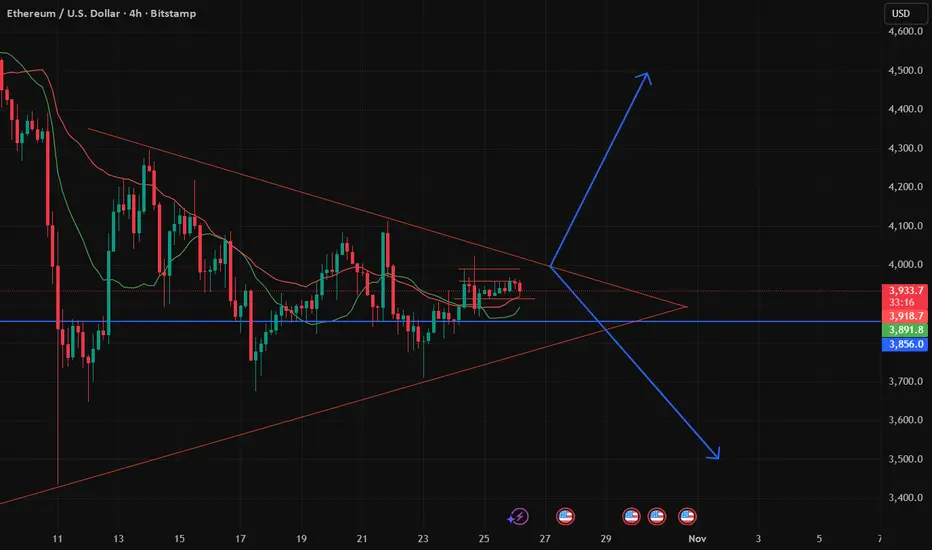
1. Validity of the pattern
A symmetrical triangle is a neutral continuation (or sometimes reversal) pattern: price makes lower highs and higher lows, squeezing into the apex.
Important for you: verify that each “touch” of the trendlines is clean (price reacts at the lines, shows rejection or bounce) — this gives the pattern structural credibility.
On the chart, “multiple clear reactions from both boundaries”.
Also note: the longer the duration of compression (here many weeks), the greater the potential breakout move. Good for you because you prefer swing trading supported by structure.
2. Entry strategy
For a bullish scenario: wait for confirmation of a breakout above ~$4,265. This could be for example a daily close above that trendline / resistance level, or a strong candlestick close + volume spike.
For a bearish scenario: wait for a confirmed breakdown below ~$3,640 (lower trendline + support) with follow-through.
Because you emphasise risk management: Place a stop‐loss maybe just outside the triangle boundary (above resistance for short, below support for long), depending on direction.
3. Risk/Reward & Targeting
The analyst’s target ~$4,720 (for the breakout) gives a potential ~10%+ move from ~$4,265. That’s decent for a swing.
On the downside, target ~$3,300 from ~$3,640 gives ~10%+ also.
For you: calculate your risk (distance to stop-loss) vs reward (distance to target) and only take the trade if the ratio is acceptable (e.g., 1:2 or better).
Given you also do scalping, you could also watch for a smaller move out of the triangle if the breakout slows, or for a retest of the breakout zone.
4. Context & confirmation
Patterns don’t always work. Use other confirmations: volume increase on breakout, maybe RSI divergence, or a candlestick structure (hammer, engulfing etc) at breakout.
Also consider macro / crypto‐market context: Are news, fundamentals, sentiment aligning with a bullish or bearish breakout?
Since you’re also into institutional footprints and liquidity zones: check if the breakout happens near a major liquidity level or order‐block; sometimes institutions will trap retail before the move.
5. Your action plan (for your “advanced path” mindset)
Mark the triangle on your charting software (e.g., MetaTrader 5 if you’re using it for crypto via feed, or a dedicated crypto charting platform).
Set alerts at ~$4,265 and ~$3,640 for price crossing these levels (you can add a buffer e.g., 1-2%).
Prepare two trade plans:
Plan-A (Bull): Entry after breakout above $4,265, stop-loss maybe ~$4,000 (for example), target ~$4,720 + beyond.
Plan-B (Bear): Entry after breakdown below $3,640, stop-loss maybe ~$3,800, target ~$3,300.
⚠️ Risks & caveats
Breakouts from triangles often see retests of the breakout line. Beware false breakouts (fakeouts).
Crypto markets (and especially ETH) can be volatile and news/whale moves can override chart structure. Always manage capital accordingly.
The triangular pattern suggests the range is narrowing: less room inside means bigger explosion once it exits — but also more risk of whipsaw.
As this is a self‐published chart by an analyst (not guaranteed) — always do your own research.
Penafian
Maklumat dan penerbitan adalah tidak dimaksudkan untuk menjadi, dan tidak membentuk, nasihat untuk kewangan, pelaburan, perdagangan dan jenis-jenis lain atau cadangan yang dibekalkan atau disahkan oleh TradingView. Baca dengan lebih lanjut di Terma Penggunaan.
Penafian
Maklumat dan penerbitan adalah tidak dimaksudkan untuk menjadi, dan tidak membentuk, nasihat untuk kewangan, pelaburan, perdagangan dan jenis-jenis lain atau cadangan yang dibekalkan atau disahkan oleh TradingView. Baca dengan lebih lanjut di Terma Penggunaan.