Intro / Overview
The Bullish Harami is a candlestick reversal pattern that often forms at the end of a downtrend.
It signals a possible shift where sellers weaken and buyers begin to step in.
The first candle’s low must be a swing low, and this level can also be used as a stop-loss reference.
To trade it effectively, spotting the formation is not enough — strict validation and invalidation rules are key to avoid false signals.
✨ Concept
A Bullish Harami is a two-candle pattern:
- First candle (Red🔴): A strong bearish candle showing seller dominance (swing low).
- Second candle (Green🟢): A smaller bullish candle whose body is fully inside the prior red candle’s body (wicks ideally inside).
This forms the “harami” structure, where the green candle looks like it is “inside the red candle,” suggesting a pause in bearish pressure and potential reversal.
📖 How to Use
1️⃣ Identify the pattern: Look for a large red candle followed by a smaller green candle contained within it.
2️⃣ Validation Point: The setup is validated if price closes above the open of the red candle within the next few candles.
3️⃣ Invalidation Point: The setup is invalidated if price closes below the close of the red candle before validation occurs.
4️⃣ Stop-Loss & Targets:
- Stop-loss (SL): Place at or just below the swing low (first red candle low).
- Target (TP): 1x, 2x, or more times the distance between entry and stop-loss.
5️⃣ Enhance Reliability: Combine with support levels, trendlines, moving averages, or other candlestick signals to filter out weak setups.
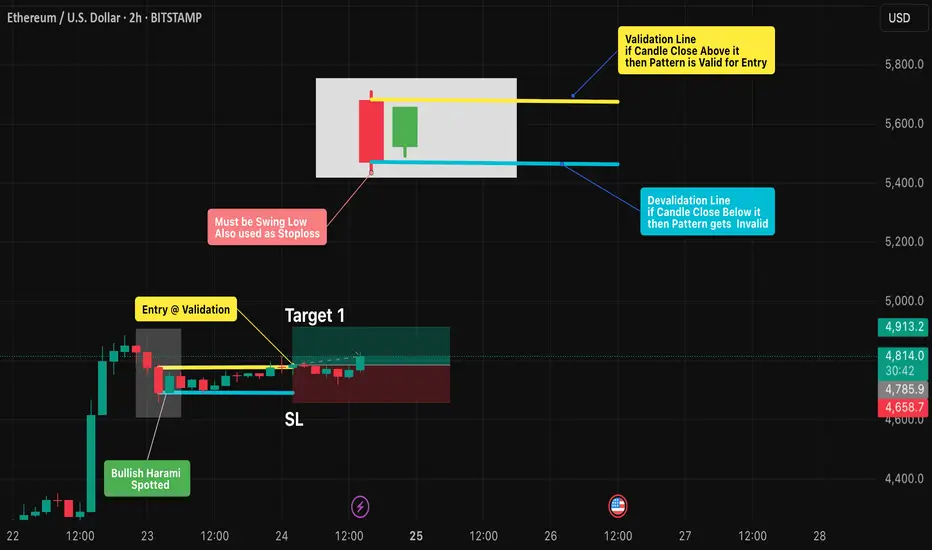
📊 Chart Explanation – Step by Step
✔ The Bullish Harami pattern was spotted after a clear downtrend.
✔ The following candle closed above the red candle’s open → Validation confirmed ✅.
✔ A long entry was taken on the same candle.
✔ The Bullish Harami pattern has also been drawn and highlighted on the chart.
🔍 Observation
- If Target 1 is achieved → book 2 lots, and trail the remaining position with a stop-loss.
- Harami is only a potential reversal → confirmation is necessary.
- Breakout above the red candle’s open = buyers in control 🟢.
- Breakdown below the red candle’s close = setup failure ❌.
- Patience is key — wait for confirmation before entering.
📌 Why It Matters?
The Bullish Harami helps traders by:
- Reducing false reversal trades with strict rules.
- Providing clear entry/exit levels with discipline.
- Enforcing risk management via pre-defined SL & TP.
✅ Conclusion
The Bullish Harami becomes powerful when traded with discipline.
By marking the open and close of the red candle, traders can clearly separate a valid long trade from a failed setup.
With a stop-loss at the swing low and take-profits at 1x, 2x, or more, while trailing further lots, the Harami offers a structured, rule-based strategy.
⚠️ Always remember: the pattern shows possibility → price confirmation makes it probability.
⚠️ Disclaimer
For educational purposes only · Not SEBI registered · Not a buy/sell recommendation · No investment advice — purely a learning resource
The Bullish Harami is a candlestick reversal pattern that often forms at the end of a downtrend.
It signals a possible shift where sellers weaken and buyers begin to step in.
The first candle’s low must be a swing low, and this level can also be used as a stop-loss reference.
To trade it effectively, spotting the formation is not enough — strict validation and invalidation rules are key to avoid false signals.
✨ Concept
A Bullish Harami is a two-candle pattern:
- First candle (Red🔴): A strong bearish candle showing seller dominance (swing low).
- Second candle (Green🟢): A smaller bullish candle whose body is fully inside the prior red candle’s body (wicks ideally inside).
This forms the “harami” structure, where the green candle looks like it is “inside the red candle,” suggesting a pause in bearish pressure and potential reversal.
📖 How to Use
1️⃣ Identify the pattern: Look for a large red candle followed by a smaller green candle contained within it.
2️⃣ Validation Point: The setup is validated if price closes above the open of the red candle within the next few candles.
3️⃣ Invalidation Point: The setup is invalidated if price closes below the close of the red candle before validation occurs.
4️⃣ Stop-Loss & Targets:
- Stop-loss (SL): Place at or just below the swing low (first red candle low).
- Target (TP): 1x, 2x, or more times the distance between entry and stop-loss.
5️⃣ Enhance Reliability: Combine with support levels, trendlines, moving averages, or other candlestick signals to filter out weak setups.
📊 Chart Explanation – Step by Step
✔ The Bullish Harami pattern was spotted after a clear downtrend.
✔ The following candle closed above the red candle’s open → Validation confirmed ✅.
✔ A long entry was taken on the same candle.
✔ The Bullish Harami pattern has also been drawn and highlighted on the chart.
🔍 Observation
- If Target 1 is achieved → book 2 lots, and trail the remaining position with a stop-loss.
- Harami is only a potential reversal → confirmation is necessary.
- Breakout above the red candle’s open = buyers in control 🟢.
- Breakdown below the red candle’s close = setup failure ❌.
- Patience is key — wait for confirmation before entering.
📌 Why It Matters?
The Bullish Harami helps traders by:
- Reducing false reversal trades with strict rules.
- Providing clear entry/exit levels with discipline.
- Enforcing risk management via pre-defined SL & TP.
✅ Conclusion
The Bullish Harami becomes powerful when traded with discipline.
By marking the open and close of the red candle, traders can clearly separate a valid long trade from a failed setup.
With a stop-loss at the swing low and take-profits at 1x, 2x, or more, while trailing further lots, the Harami offers a structured, rule-based strategy.
⚠️ Always remember: the pattern shows possibility → price confirmation makes it probability.
⚠️ Disclaimer
For educational purposes only · Not SEBI registered · Not a buy/sell recommendation · No investment advice — purely a learning resource
Nota
On 25 Aug, 2025 (04:00) ⏰, the stop-loss level was triggered 📉, concluding this setup. No further monitoring will be carried out 🚫 as the trade idea has been invalidated.Penerbitan berkaitan
Penafian
The information and publications are not meant to be, and do not constitute, financial, investment, trading, or other types of advice or recommendations supplied or endorsed by TradingView. Read more in the Terms of Use.
Penerbitan berkaitan
Penafian
The information and publications are not meant to be, and do not constitute, financial, investment, trading, or other types of advice or recommendations supplied or endorsed by TradingView. Read more in the Terms of Use.