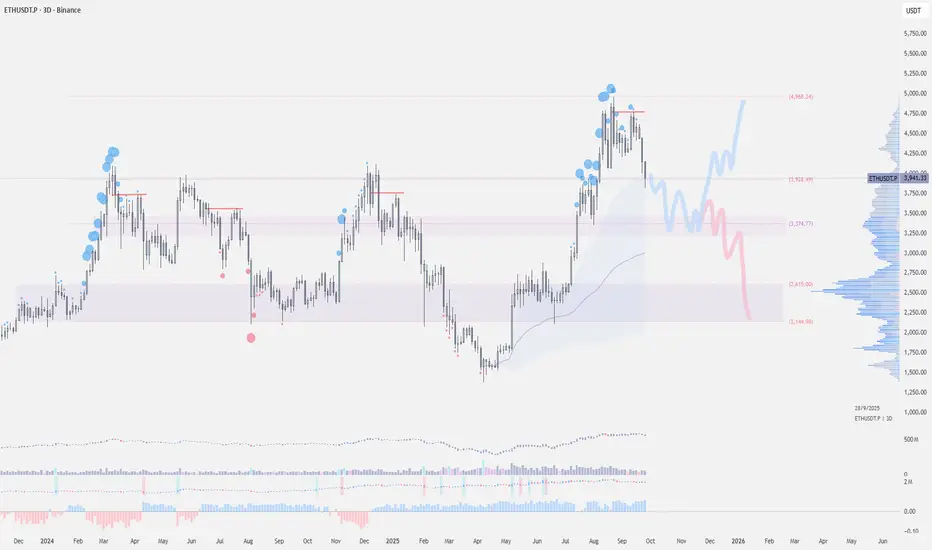
Ethereum has experienced a roughly 13% decline over the past week, primarily due to deleveraging triggered by shifting expectations around rate cuts. The chart indicates that each time the price tests a previous high for the second time, it tends to decline in a bearish retest.
The $3800 level is a critical support zone. If this support holds, it could pave the way for a rally, potentially retesting the $4800–$5000 range.
However, a break below $3,800 could lead to further declines, targeting the $3500–$3200 zone. In a more bearish scenario, a drop to $2600–$2400 is possible.
Tealstreet.io Trade Faster & Trade Easier
Content in partnership with:
twitter.com/mooncakexbt
twitter.com/huskyXBT
Content in partnership with:
twitter.com/mooncakexbt
twitter.com/huskyXBT
Penafian
Maklumat dan penerbitan adalah tidak dimaksudkan untuk menjadi, dan tidak membentuk, nasihat untuk kewangan, pelaburan, perdagangan dan jenis-jenis lain atau cadangan yang dibekalkan atau disahkan oleh TradingView. Baca dengan lebih lanjut di Terma Penggunaan.