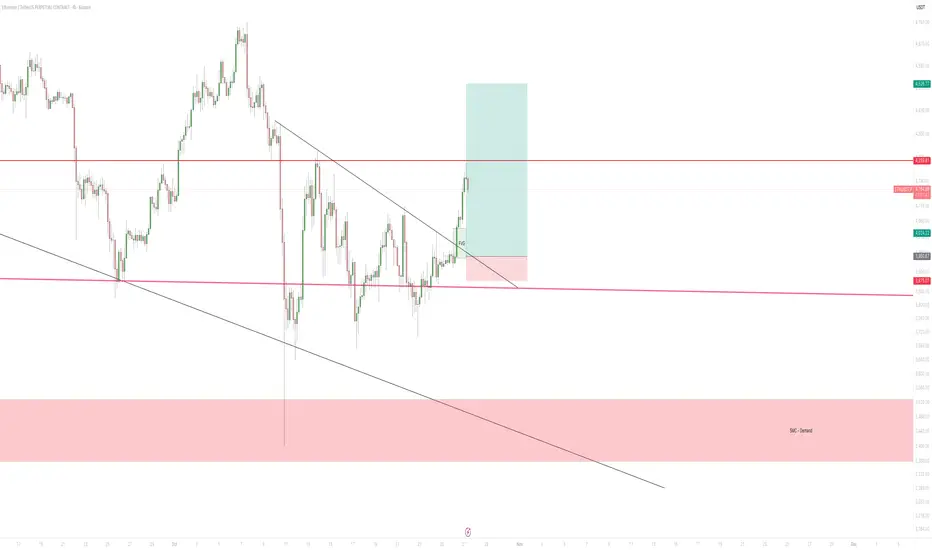
This chart shows a clear breakout from a descending trendline, indicating a potential shift from bearish to bullish momentum. The market had previously been in a downtrend, forming a series of lower highs and lower lows, but price has now broken above that structure. After the breakout, there’s a slight pullback toward the former resistance area, which is now acting as support. This zone also aligns with a Fair Value Gap (FVG), suggesting a short-term demand area where buyers might step in to defend price.
Currently, price is consolidating just above that zone, which often happens during a retest phase before a possible continuation move higher. The upper red line represents a key resistance level, marking a logical take-profit zone based on previous structure highs. The larger red box below the chart shows a major demand zone, which would act as strong support if price were to fall back into that area.
The trade setup displayed on the chart is a long position with a favorable risk-to-reward ratio — entry after the breakout and retest, stop loss below the FVG and trendline area, and target near the upper resistance zone. As long as price remains above the retested breakout zone, the bias stays bullish and a continuation toward higher levels is likely. However, if the market closes back below the broken trendline or dips into the deeper red demand zone, it would invalidate the bullish scenario and signal renewed bearish pressure.
In short, the chart illustrates a bullish breakout and retest pattern with potential for continuation, but with clear invalidation levels defined below the current structure.
Penafian
The information and publications are not meant to be, and do not constitute, financial, investment, trading, or other types of advice or recommendations supplied or endorsed by TradingView. Read more in the Terms of Use.
Penafian
The information and publications are not meant to be, and do not constitute, financial, investment, trading, or other types of advice or recommendations supplied or endorsed by TradingView. Read more in the Terms of Use.