A “Dragonfly” doji depicts a day on which prices opened high, sold off, and then returned to the opening price. Dragonflies are fairly infrequent. When they do occur, however, they often resolve bullishly (provided the Forex pair is not already overbought as show by Bollinger bands and indicators such as stochastic).
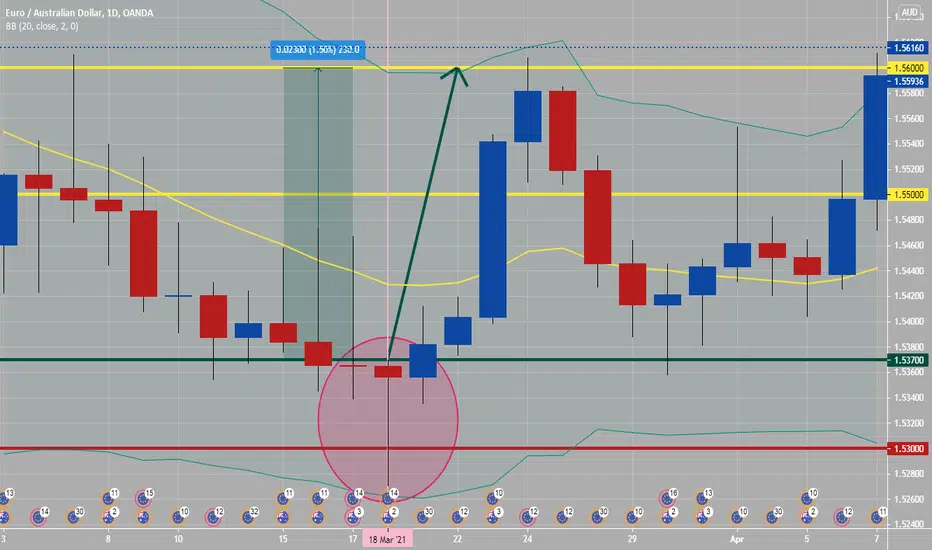
See daily attached chart of dragon fly candle, which was oversold and located at the lower band of Bollinger bands and at round numbers from 1.53000 to 1.53700. This is a great candlestick to plan for price action to continue to be bullish from, especially if this happened early in week. Noted dragonfly doji happened on a Thursday and lasted for around five days.
See daily attached chart of dragon fly candle, which was oversold and located at the lower band of Bollinger bands and at round numbers from 1.53000 to 1.53700. This is a great candlestick to plan for price action to continue to be bullish from, especially if this happened early in week. Noted dragonfly doji happened on a Thursday and lasted for around five days.
Penafian
Maklumat dan penerbitan adalah tidak bertujuan, dan tidak membentuk, nasihat atau cadangan kewangan, pelaburan, dagangan atau jenis lain yang diberikan atau disahkan oleh TradingView. Baca lebih dalam Terma Penggunaan.
Penafian
Maklumat dan penerbitan adalah tidak bertujuan, dan tidak membentuk, nasihat atau cadangan kewangan, pelaburan, dagangan atau jenis lain yang diberikan atau disahkan oleh TradingView. Baca lebih dalam Terma Penggunaan.