A doji represents an equilibrium between supply and demand, a tug of war that neither the bulls nor bears are winning. In the case of an uptrend, the bulls have by definition won previous battles because prices have moved higher. Now, the outcome of the latest skirmish is in doubt.
After a long downtrend, the opposite is true. The bears have been victorious in previous battles, forcing prices down. Now the bulls have found courage to buy, and the tide may be ready to turn.
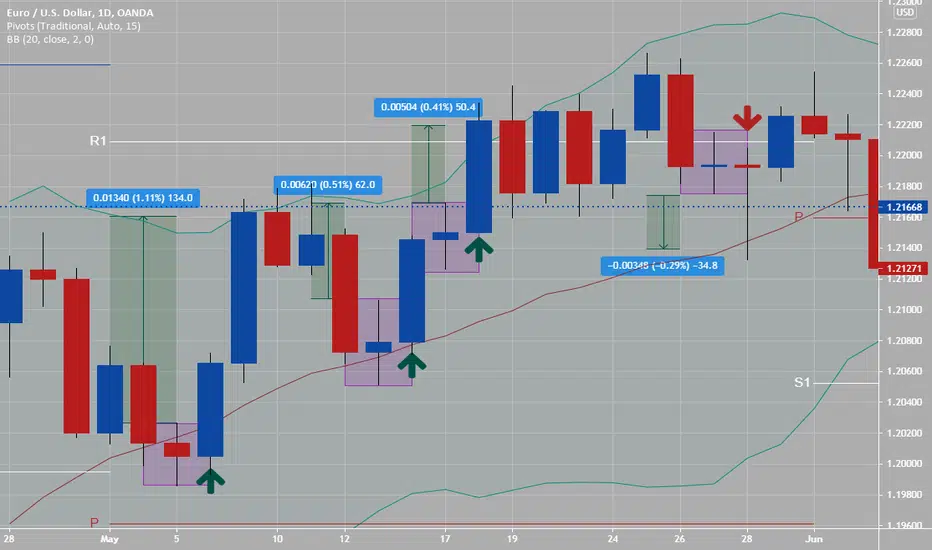
How I trade daily doji's (rules):
1) Place a news buy (long) or sell (short) order next session or daily candle.
2) Place buy order 1 pip above highest price action of daily doji candle
3) Place sell order 1 pip below lowest price action of daily doji candle
4) Which ever one is hit by the next sessions price action- the other order is turned into a stop loss order.
5) Examples of three buy orders and one sell order on daily EURUSD example chart- with possible pip profits of 30 pips to 130 pips.
These dojis occur on every time charts, but I tend to put more weight into using these on 1 hour, 4 hour or higher charts.
After a long downtrend, the opposite is true. The bears have been victorious in previous battles, forcing prices down. Now the bulls have found courage to buy, and the tide may be ready to turn.
How I trade daily doji's (rules):
1) Place a news buy (long) or sell (short) order next session or daily candle.
2) Place buy order 1 pip above highest price action of daily doji candle
3) Place sell order 1 pip below lowest price action of daily doji candle
4) Which ever one is hit by the next sessions price action- the other order is turned into a stop loss order.
5) Examples of three buy orders and one sell order on daily EURUSD example chart- with possible pip profits of 30 pips to 130 pips.
These dojis occur on every time charts, but I tend to put more weight into using these on 1 hour, 4 hour or higher charts.
Penafian
Maklumat dan penerbitan adalah tidak dimaksudkan untuk menjadi, dan tidak membentuk, nasihat untuk kewangan, pelaburan, perdagangan dan jenis-jenis lain atau cadangan yang dibekalkan atau disahkan oleh TradingView. Baca dengan lebih lanjut di Terma Penggunaan.
Penafian
Maklumat dan penerbitan adalah tidak dimaksudkan untuk menjadi, dan tidak membentuk, nasihat untuk kewangan, pelaburan, perdagangan dan jenis-jenis lain atau cadangan yang dibekalkan atau disahkan oleh TradingView. Baca dengan lebih lanjut di Terma Penggunaan.