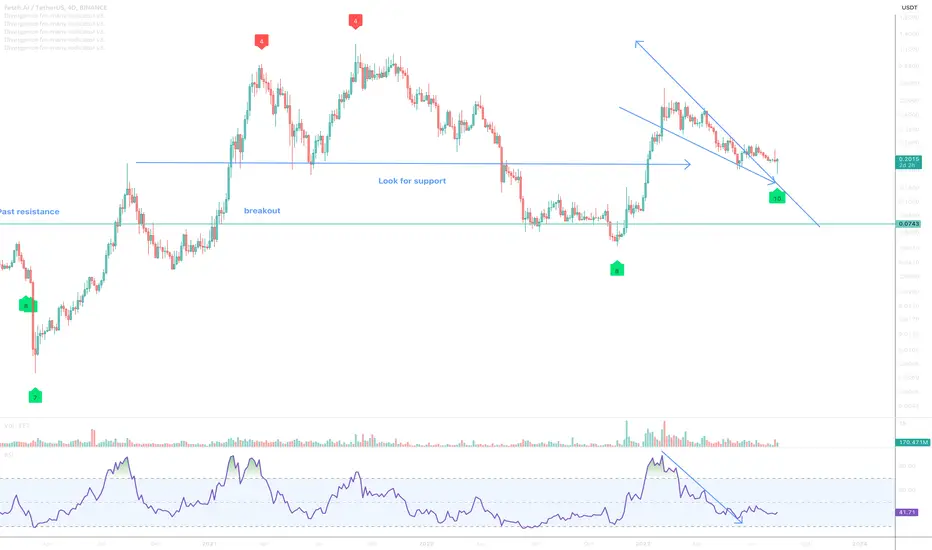
On the above 4-day chart price action has corrected 70% since the sell signal in November. Now is a excellent moment to be long. Why?
1) Price action and RSI resistance breakout.
2) Regular bullish divergence. Multiple oscillators are printing positive divergence with price action.
3) Price action tests past support that first printed 3 years ago.
Is it possible for price action to fall further? Sure.
Is it probable? No.
Ww
Type: trade
Risk: <=6% of portfolio
Timeframe: Now
Return: Awesome return. Will say elsewhere
Dagangan aktif
Nota
P's, remember the GRM support post for BTC pairs? Have a lookie for this one...Nota
might not feel like it but up 30% in the last 15 daysNota
Just to reiterate the above update, but you would have increased your Satoshi value by half in the last 30 days with this trade. It is important to remember that is the only purpose of this speculative game, increase the number of Bitcoins you hold. Have a plan, make it work.. Dagangan aktif
** Close swing trades this weekend **Nota
GRM support confirmedDagangan aktif
Nota
on supportNota
GRM support confirmed (again).Nota
The last thing you want to see if you're bear is price action entering a bear flag formation.Nota
A long from 27 cents would be good.Nota
The above comment remains true. Has a few asks, now the answer. Time for a cuppa.Daily
Nota
170% so far. Not long until target. Do you know what it is?Nota
Now up 600%.Price action is fast approaching the bull flag extension. Use the exit liquidity provided by the AI hype train in the coming weeks to unwind long positions.
Monthly
Dagangan ditutup: sasaran tercapai
Flag extension met.. Penerbitan berkaitan
Penafian
Maklumat dan penerbitan adalah tidak dimaksudkan untuk menjadi, dan tidak membentuk, nasihat untuk kewangan, pelaburan, perdagangan dan jenis-jenis lain atau cadangan yang dibekalkan atau disahkan oleh TradingView. Baca dengan lebih lanjut di Terma Penggunaan.
Penerbitan berkaitan
Penafian
Maklumat dan penerbitan adalah tidak dimaksudkan untuk menjadi, dan tidak membentuk, nasihat untuk kewangan, pelaburan, perdagangan dan jenis-jenis lain atau cadangan yang dibekalkan atau disahkan oleh TradingView. Baca dengan lebih lanjut di Terma Penggunaan.