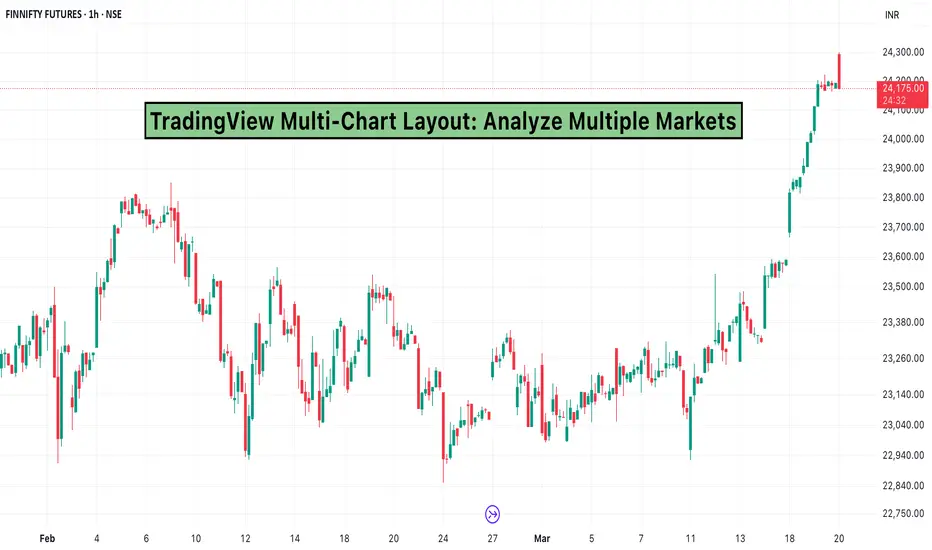
Effective market analysis requires tracking multiple assets simultaneously. TradingView’s multi-chart layout allows traders to monitor different markets, time frames, and instruments within a single workspace.
1. Why Use the Multi-Chart Layout?
Compare Different Markets: Analyze stocks, forex pairs, and commodities side by side.
Monitor Multiple Time Frames: Track short-term trends while keeping an eye on the bigger picture.
Improve Efficiency: Avoid switching between tabs and maintain a seamless trading experience.
Enhance Strategy Execution: Spot correlations and divergences across different instruments.
2. How to Set Up a Multi-Chart Layout in TradingView
Open the TradingView Chart – Start by launching the TradingView platform.
Select the Multi-Chart Layout – Click on the "Select Layout" option in the toolbar and choose from available configurations (2, 4, 6, or more charts per screen).
Add Different Markets or Time Frames – Assign each section of the layout to a different asset, index, or time frame.
Sync Chart Settings – Enable options like synchronized time frames, crosshairs, and drawings for seamless comparisons.
Customize Each Chart – Apply indicators, change themes, and adjust chart types to fit your analysis.
3. Best Practices for Using Multi-Chart Layouts
Use Different Time Frames for the Same Asset: Helps in confirming trends before making a trade.
Compare Correlated Assets: Track movements in related markets, such as gold and the US dollar.
Monitor Leading Indicators: Watch for signals in major indices before entering trades in individual stocks.
Keep the Layout Organized: Avoid clutter by using only the necessary number of charts for your strategy.
4. Who Should Use Multi-Chart Layouts?
Day Traders: Quickly compare assets and spot opportunities in real time.
Swing Traders: Analyze market trends across different time frames before entering trades.
Portfolio Managers: Track multiple holdings simultaneously to manage risk effectively.
Macro Analysts: Compare global markets and intermarket relationships.
Conclusion
The TradingView multi-chart layout is a powerful tool that helps traders analyze multiple markets efficiently. Whether you are tracking stocks, forex, or commodities, using this feature can enhance decision-making and improve your trading strategy.
Elevate your Trading Experience 🚀
📱 Download Dhan App on iOS and Android and Start Trading.
📱 Download Dhan App on iOS and Android and Start Trading.
Penafian
Maklumat dan penerbitan adalah tidak dimaksudkan untuk menjadi, dan tidak membentuk, nasihat untuk kewangan, pelaburan, perdagangan dan jenis-jenis lain atau cadangan yang dibekalkan atau disahkan oleh TradingView. Baca dengan lebih lanjut di Terma Penggunaan.
