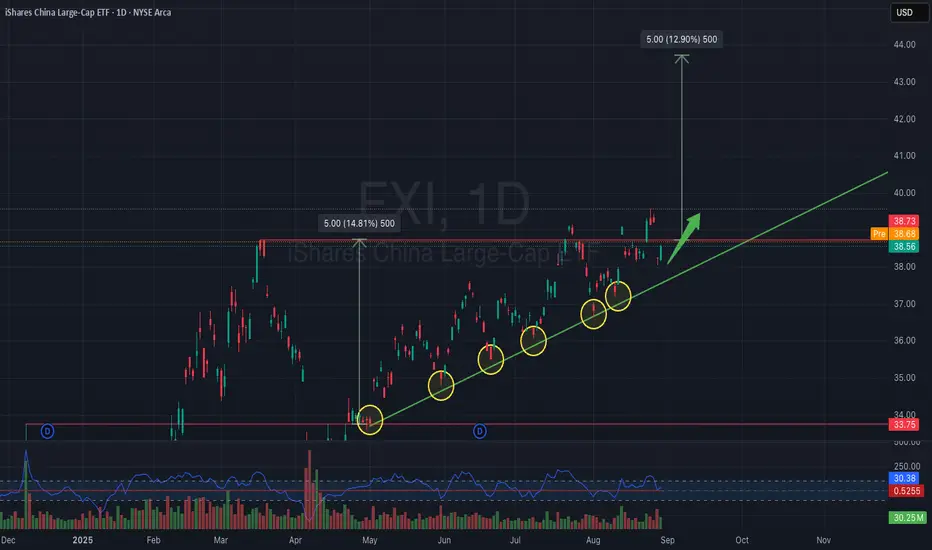
The chart of iShares China Large-Cap ETF (FXI) shows a strong ascending trendline, tested multiple times (yellow circles), confirming bullish support.
Currently, FXI is consolidating just below resistance at $39, and a breakout above this level could trigger a strong upward move. The projected target is around $43–44, which aligns with a 12–13% upside potential.
Entry Zone: Above $39 breakout
Target Price: $43–44
Stop Loss: Below $37 (trendline support)
Momentum is supported by higher lows, consistent trendline touches, and a constructive RSI setup. If the breakout holds, bulls may push FXI toward prior highs.
Penafian
Maklumat dan penerbitan adalah tidak dimaksudkan untuk menjadi, dan tidak membentuk, nasihat untuk kewangan, pelaburan, perdagangan dan jenis-jenis lain atau cadangan yang dibekalkan atau disahkan oleh TradingView. Baca dengan lebih lanjut di Terma Penggunaan.
Penafian
Maklumat dan penerbitan adalah tidak dimaksudkan untuk menjadi, dan tidak membentuk, nasihat untuk kewangan, pelaburan, perdagangan dan jenis-jenis lain atau cadangan yang dibekalkan atau disahkan oleh TradingView. Baca dengan lebih lanjut di Terma Penggunaan.