### 🔍 Technical Snapshot
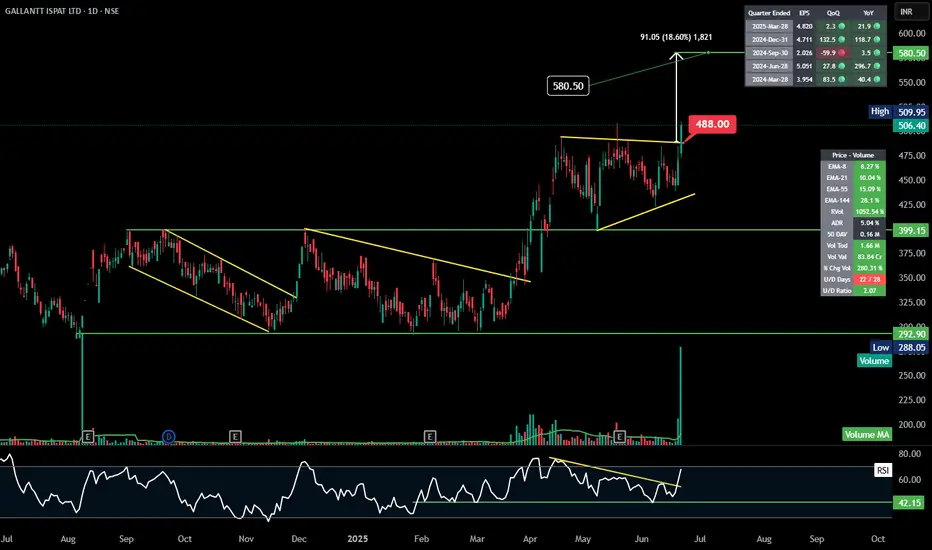
- **Breakout Alert**: The symmetrical triangle shows a bullish breakout above ₹488, with a strong follow-through toward ₹506.40. That breakout level was respected perfectly—classic pattern behavior.
- **Target**: The projected target of ₹580.50 looks feasible based on the height of the triangle and the breakout momentum.
- **Volume Surge**: Today's volume is a whopping 1.66M—over 10x the 5-day average—with an rVol of 1052%. That kind of participation typically supports sustained momentum.
### 📉 Trend and Indicators
- **Descending Channels**: The stock escaped not one but *two* descending channels—suggesting a reversal in structure.
- **RSI at 42.15**: Room for upside. It’s not overbought, meaning there’s still breathing room for a move toward the target.
- **EMA Support**: Price is comfortably above short and long-term EMAs (8, 21, 55, 144), which is a bullish alignment.
### 🧾 Fundamental Flash
- **EPS Growth**: Consistent quarterly growth, with a standout 599.9% QoQ jump in Sep 2024. That's explosive.
- **U/D Ratio**: 22 up days out of 28 with a U/D Ratio of 2.07—implying steady buying pressure over time.
Penafian
Maklumat dan penerbitan adalah tidak dimaksudkan untuk menjadi, dan tidak membentuk, nasihat untuk kewangan, pelaburan, perdagangan dan jenis-jenis lain atau cadangan yang dibekalkan atau disahkan oleh TradingView. Baca dengan lebih lanjut di Terma Penggunaan.
Penafian
Maklumat dan penerbitan adalah tidak dimaksudkan untuk menjadi, dan tidak membentuk, nasihat untuk kewangan, pelaburan, perdagangan dan jenis-jenis lain atau cadangan yang dibekalkan atau disahkan oleh TradingView. Baca dengan lebih lanjut di Terma Penggunaan.