GBP/USD Weekly Analysis – Symmetrical Triangle Breakout Targeting 1.47+
🧠 Market Context:
Over the past few years, the British Pound vs US Dollar (GBP/USD) has experienced a significant corrective phase following its previous major swing highs. From mid-2021 onward, price action began forming a distinct Symmetrical Triangle — a classic technical pattern representing a period of consolidation and indecision in the market.
This triangle reflects lower highs and higher lows, compressing volatility and indicating a buildup before a major directional move. After nearly 3 years of compression, the pair has finally broken out to the upside, signaling that the bulls are now taking charge of market momentum.
🔷 Pattern Highlight: Symmetrical Triangle
Formation Duration: Mid-2021 to Q2 2025 (approximately 4 years).
Structure: A narrowing triangle bounded by a descending resistance and ascending support line.
Psychology: Each swing within the triangle reflects growing equilibrium between buyers and sellers. As the triangle narrows, momentum builds and eventually leads to a breakout.
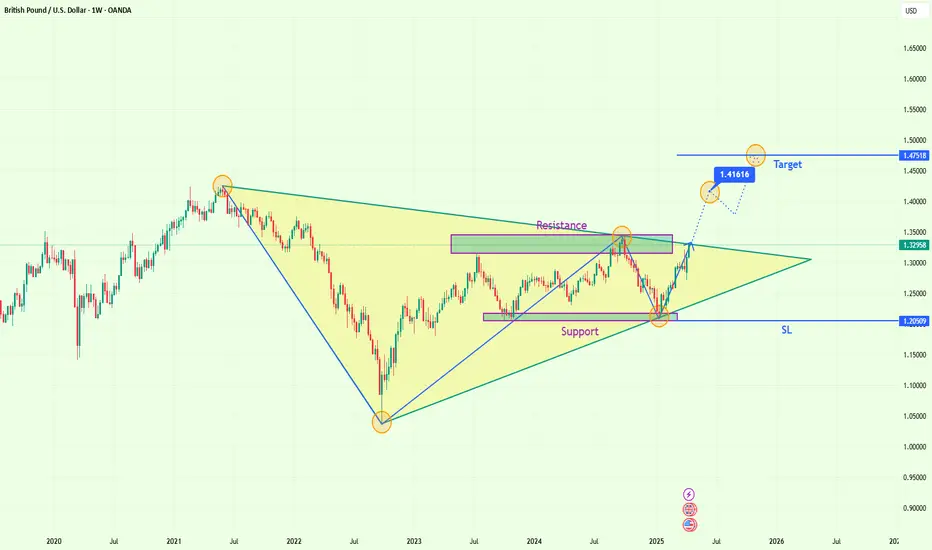
Breakout Direction: Bullish, confirmed by a weekly close above the upper trendline and resistance zone near 1.3300.
🧱 Key Technical Levels:
Major Support: 1.20509 (triangle base and invalidation level).
Breakout Zone: 1.32500–1.33500 (recent breakout confirmed with strong bullish candle).
First Resistance / Target: 1.41616 (historical resistance and internal projection from the breakout).
Final Target: 1.47518 (projected using the height of the triangle added to breakout point – classical measured move technique).
📈 Trade Setup Summary:
Component Level Strategy
Entry 1.3250 – 1.3350 Enter on breakout confirmation or wait for pullback retest
TP1 1.41616 Based on previous horizontal resistance
TP2 (Target) 1.47518 Based on triangle’s measured move
Stop Loss 1.20509 Below the triangle structure – invalidates the setup
🛠️ Technical Confirmation:
✅ Weekly Breakout: A clean candle close above key resistance.
✅ Bullish Market Structure: Series of higher lows forming since late 2022.
✅ Volume & Momentum (if observed): Breakout strength can be validated by volume spikes and strong momentum indicators like RSI or MACD.
✅ Support Flip: The prior resistance (1.3300) is expected to now act as a support zone.
📊 Risk-Reward Profile:
The triangle breakout setup offers a favorable R:R ratio exceeding 3:1, depending on entry strategy. The extended consolidation implies that the breakout can sustain over multiple months, making it attractive for swing and position traders.
🧭 Potential Scenarios:
✅ Bullish Continuation:
Price sustains above 1.3300, retests, and resumes the bullish leg.
Buyers target 1.4160 initially, then stretch towards 1.4750 by late 2025 or early 2026.
⚠️ Pullback/Retest:
Price may revisit the 1.3200–1.3300 region to retest the breakout level before continuing higher.
This zone presents a potential buy-on-dip opportunity.
❌ Bearish Breakdown (Invalidation):
If price closes back below 1.2050, the breakout becomes invalid and a deeper correction is likely.
🔍 Trading Psychology Insight:
The prolonged triangle formation signals a market waiting for clarity — whether due to macroeconomic shifts, rate decisions, or geopolitical factors. A bullish breakout now likely indicates growing investor confidence in GBP strength or USD weakness in the longer term.
Such breakouts from long-term compressions are often the start of multi-leg impulsive waves, which can trend for months.
🧠 Market Context:
Over the past few years, the British Pound vs US Dollar (GBP/USD) has experienced a significant corrective phase following its previous major swing highs. From mid-2021 onward, price action began forming a distinct Symmetrical Triangle — a classic technical pattern representing a period of consolidation and indecision in the market.
This triangle reflects lower highs and higher lows, compressing volatility and indicating a buildup before a major directional move. After nearly 3 years of compression, the pair has finally broken out to the upside, signaling that the bulls are now taking charge of market momentum.
🔷 Pattern Highlight: Symmetrical Triangle
Formation Duration: Mid-2021 to Q2 2025 (approximately 4 years).
Structure: A narrowing triangle bounded by a descending resistance and ascending support line.
Psychology: Each swing within the triangle reflects growing equilibrium between buyers and sellers. As the triangle narrows, momentum builds and eventually leads to a breakout.
Breakout Direction: Bullish, confirmed by a weekly close above the upper trendline and resistance zone near 1.3300.
🧱 Key Technical Levels:
Major Support: 1.20509 (triangle base and invalidation level).
Breakout Zone: 1.32500–1.33500 (recent breakout confirmed with strong bullish candle).
First Resistance / Target: 1.41616 (historical resistance and internal projection from the breakout).
Final Target: 1.47518 (projected using the height of the triangle added to breakout point – classical measured move technique).
📈 Trade Setup Summary:
Component Level Strategy
Entry 1.3250 – 1.3350 Enter on breakout confirmation or wait for pullback retest
TP1 1.41616 Based on previous horizontal resistance
TP2 (Target) 1.47518 Based on triangle’s measured move
Stop Loss 1.20509 Below the triangle structure – invalidates the setup
🛠️ Technical Confirmation:
✅ Weekly Breakout: A clean candle close above key resistance.
✅ Bullish Market Structure: Series of higher lows forming since late 2022.
✅ Volume & Momentum (if observed): Breakout strength can be validated by volume spikes and strong momentum indicators like RSI or MACD.
✅ Support Flip: The prior resistance (1.3300) is expected to now act as a support zone.
📊 Risk-Reward Profile:
The triangle breakout setup offers a favorable R:R ratio exceeding 3:1, depending on entry strategy. The extended consolidation implies that the breakout can sustain over multiple months, making it attractive for swing and position traders.
🧭 Potential Scenarios:
✅ Bullish Continuation:
Price sustains above 1.3300, retests, and resumes the bullish leg.
Buyers target 1.4160 initially, then stretch towards 1.4750 by late 2025 or early 2026.
⚠️ Pullback/Retest:
Price may revisit the 1.3200–1.3300 region to retest the breakout level before continuing higher.
This zone presents a potential buy-on-dip opportunity.
❌ Bearish Breakdown (Invalidation):
If price closes back below 1.2050, the breakout becomes invalid and a deeper correction is likely.
🔍 Trading Psychology Insight:
The prolonged triangle formation signals a market waiting for clarity — whether due to macroeconomic shifts, rate decisions, or geopolitical factors. A bullish breakout now likely indicates growing investor confidence in GBP strength or USD weakness in the longer term.
Such breakouts from long-term compressions are often the start of multi-leg impulsive waves, which can trend for months.
Penerbitan berkaitan
Penafian
Maklumat dan penerbitan adalah tidak dimaksudkan untuk menjadi, dan tidak membentuk, nasihat untuk kewangan, pelaburan, perdagangan dan jenis-jenis lain atau cadangan yang dibekalkan atau disahkan oleh TradingView. Baca dengan lebih lanjut di Terma Penggunaan.
Penerbitan berkaitan
Penafian
Maklumat dan penerbitan adalah tidak dimaksudkan untuk menjadi, dan tidak membentuk, nasihat untuk kewangan, pelaburan, perdagangan dan jenis-jenis lain atau cadangan yang dibekalkan atau disahkan oleh TradingView. Baca dengan lebih lanjut di Terma Penggunaan.