📊 Pattern Overview
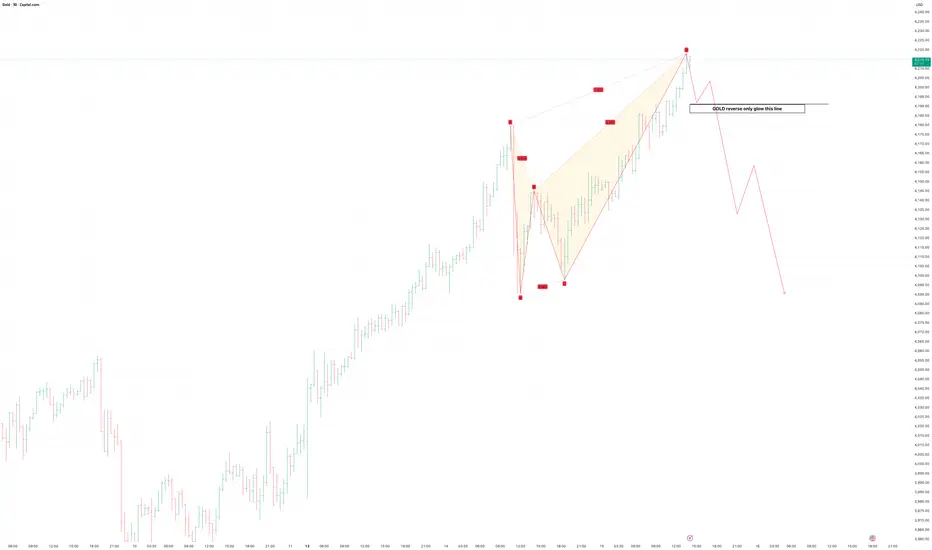
The chart shows a Bearish Harmonic Pattern – likely a Bearish Gartley / Bat completion near the top zone.
You’ve marked the key structure points X–A–B–C–D, and the final leg D has completed near a precise Fibonacci confluence, indicating potential reversal.
🔍 Momentum & Confirmation
Expect bearish divergence on RSI/MACD near point D.
Watch for reversal candles — like bearish engulfing or shooting star — for entry confirmation.
A break and retest below the $4,210 line adds conviction for a short setup.
✅ Summary
Parameter Observation
Pattern Bearish Harmonic (Gartley/Bat)
Current Bias Bearish Reversal Likely
Reversal Zone $4,210–$4,225
Confirmation Line $4,210 (as labeled)
Targets $4,170 → $4,110 → $4,060
Stop-loss Above $4,235 (swing high)
Conclusion
Gold’s 1H chart is signaling a potential reversal from harmonic completion.
Only if the price closes below $4,210 with momentum confirmation, we can expect a correction toward $4,100–$4,060 levels.
Until then, the structure remains in a potential reversal zone, not yet active.
Disclaimer:
This analysis is for educational and technical research purposes only and does not constitute financial advice. Always confirm trade entries using volume, price action, and your personal risk parameters.
Penafian
Maklumat dan penerbitan adalah tidak dimaksudkan untuk menjadi, dan tidak membentuk, nasihat untuk kewangan, pelaburan, perdagangan dan jenis-jenis lain atau cadangan yang dibekalkan atau disahkan oleh TradingView. Baca dengan lebih lanjut di Terma Penggunaan.
Penafian
Maklumat dan penerbitan adalah tidak dimaksudkan untuk menjadi, dan tidak membentuk, nasihat untuk kewangan, pelaburan, perdagangan dan jenis-jenis lain atau cadangan yang dibekalkan atau disahkan oleh TradingView. Baca dengan lebih lanjut di Terma Penggunaan.