XAUUSD: Market Analysis and Strategy for October 20
Gold Technical Analysis
Daily Resistance: 4380, Support: 4100
4-Hour Resistance: 4314, Support: 4180
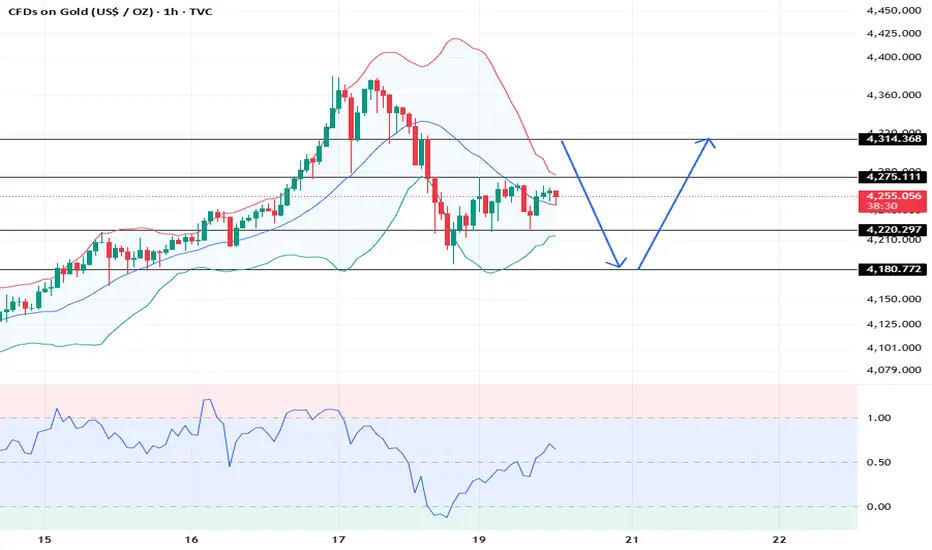
1-Hour Resistance: 4275, Support: 4220
Last Friday, gold prices retreated after hitting $4380, dropping nearly $200 intraday to a low of around $4186.
The decline stems from both the previous excessive price increase and the strengthening US dollar and tariff policy changes. Regardless, this significant decline in gold prices is bound to raise market concerns about future trends.
From the weekly chart, despite a sharp rise, the market retreated after a surge. Friday's daily chart nearly reversed Thursday's gains.
The 4-hour MACD indicator formed a downward death cross, suggesting that short-term market volatility is at least inevitable.
What is certain is that the bull market in gold's major cycle has not ended. This so-called major cycle is measured on an annual basis, meaning next year's average price will undoubtedly be higher than this year's. As for whether the market will continue to fall this week, this possibility cannot be ruled out. After this week's rebound, if it fails to hold above 4300, there is still a chance that it will test the 4200 or even 4100 levels below.
For intraday trading, sell high and buy low. The market is expected to fluctuate and consolidate.
Selling range:
SELL: near 4275
SELL: near 4315
BUY: near 4220
BUY: near 4180
More analysis👉
Daily Resistance: 4380, Support: 4100
4-Hour Resistance: 4314, Support: 4180
1-Hour Resistance: 4275, Support: 4220
Last Friday, gold prices retreated after hitting $4380, dropping nearly $200 intraday to a low of around $4186.
The decline stems from both the previous excessive price increase and the strengthening US dollar and tariff policy changes. Regardless, this significant decline in gold prices is bound to raise market concerns about future trends.
From the weekly chart, despite a sharp rise, the market retreated after a surge. Friday's daily chart nearly reversed Thursday's gains.
The 4-hour MACD indicator formed a downward death cross, suggesting that short-term market volatility is at least inevitable.
What is certain is that the bull market in gold's major cycle has not ended. This so-called major cycle is measured on an annual basis, meaning next year's average price will undoubtedly be higher than this year's. As for whether the market will continue to fall this week, this possibility cannot be ruled out. After this week's rebound, if it fails to hold above 4300, there is still a chance that it will test the 4200 or even 4100 levels below.
For intraday trading, sell high and buy low. The market is expected to fluctuate and consolidate.
Selling range:
SELL: near 4275
SELL: near 4315
BUY: near 4220
BUY: near 4180
More analysis👉
Dagangan aktif
It has fallen by more than $20 from 4315. Please protect your profits and reduce your positions.💥Telegram Channel Free Updates 👉🏻
💥This a place for learning and communication. 👉🏻
💥Provide trading guidance.👉🏻
Telegram Channel👉🏻t.me/Actuary00group
💥This a place for learning and communication. 👉🏻
💥Provide trading guidance.👉🏻
Telegram Channel👉🏻t.me/Actuary00group
Penafian
Maklumat dan penerbitan adalah tidak dimaksudkan untuk menjadi, dan tidak membentuk, nasihat untuk kewangan, pelaburan, perdagangan dan jenis-jenis lain atau cadangan yang dibekalkan atau disahkan oleh TradingView. Baca dengan lebih lanjut di Terma Penggunaan.
💥Telegram Channel Free Updates 👉🏻
💥This a place for learning and communication. 👉🏻
💥Provide trading guidance.👉🏻
Telegram Channel👉🏻t.me/Actuary00group
💥This a place for learning and communication. 👉🏻
💥Provide trading guidance.👉🏻
Telegram Channel👉🏻t.me/Actuary00group
Penafian
Maklumat dan penerbitan adalah tidak dimaksudkan untuk menjadi, dan tidak membentuk, nasihat untuk kewangan, pelaburan, perdagangan dan jenis-jenis lain atau cadangan yang dibekalkan atau disahkan oleh TradingView. Baca dengan lebih lanjut di Terma Penggunaan.