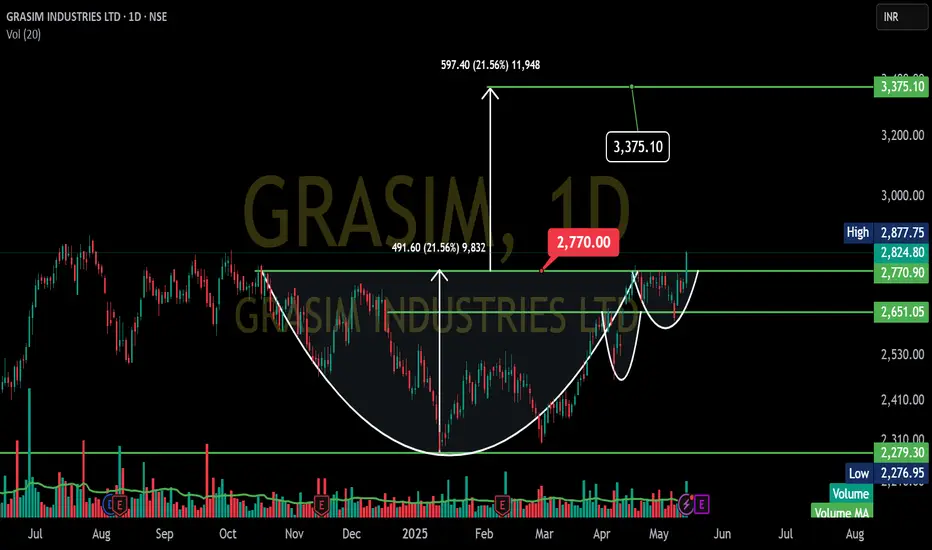
GRASIM INDUSTRIES LTD chart.
Forming a cup and handle pattern, which is generally a bullish signal.
Here's a simplified breakdown:
Cup: Notice the rounded bottom shape that formed roughly between November 2024 and April 2025. This suggests the price found support after a decline and started to move upwards again.
Handle (Potential): After reaching a high around ₹2,770, the price has pulled back a bit. This dip could be forming the "handle" of the pattern. Ideally, this handle should be a smaller downward or sideways movement.
Breakout Level: The horizontal line you've drawn around ₹2,770 acts as a resistance level. If the price breaks above this level with good volume, it could signal that the cup and handle pattern is complete and the price might move higher.
Target: Potential target around ₹3,375.10. This target is often estimated by measuring the depth of the cup and adding it to the breakout level.
Penafian
Maklumat dan penerbitan adalah tidak bertujuan, dan tidak membentuk, nasihat atau cadangan kewangan, pelaburan, dagangan atau jenis lain yang diberikan atau disahkan oleh TradingView. Baca lebih dalam Terma Penggunaan.
Penafian
Maklumat dan penerbitan adalah tidak bertujuan, dan tidak membentuk, nasihat atau cadangan kewangan, pelaburan, dagangan atau jenis lain yang diberikan atau disahkan oleh TradingView. Baca lebih dalam Terma Penggunaan.