Topic Statement:
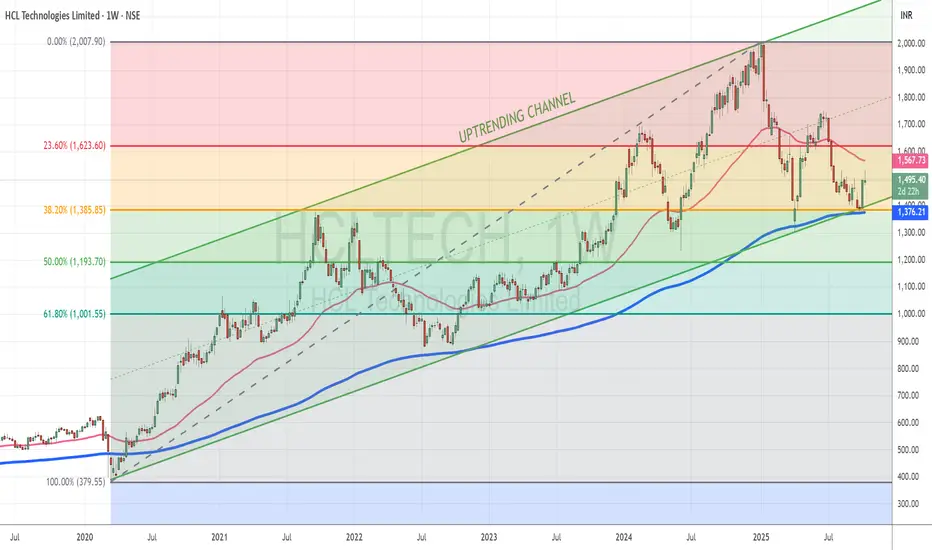
HCLTech, like other IT peers, has been dragged down by global economic policies but now shows early signs of recovery from key support levels.
Key Points:
1. The stock corrected down to the 38.2% Fibonacci retracement level at 1385, where it found strong support
2. Price reversed after touching the lower boundary of its bullish channel, reinforcing the trend structure
3. Currently trading below the 50-day EMA, the stock is oversold in the short term and presents a possible accumulation opportunity
Penafian
Maklumat dan penerbitan adalah tidak dimaksudkan untuk menjadi, dan tidak membentuk, nasihat untuk kewangan, pelaburan, perdagangan dan jenis-jenis lain atau cadangan yang dibekalkan atau disahkan oleh TradingView. Baca dengan lebih lanjut di Terma Penggunaan.
Penafian
Maklumat dan penerbitan adalah tidak dimaksudkan untuk menjadi, dan tidak membentuk, nasihat untuk kewangan, pelaburan, perdagangan dan jenis-jenis lain atau cadangan yang dibekalkan atau disahkan oleh TradingView. Baca dengan lebih lanjut di Terma Penggunaan.