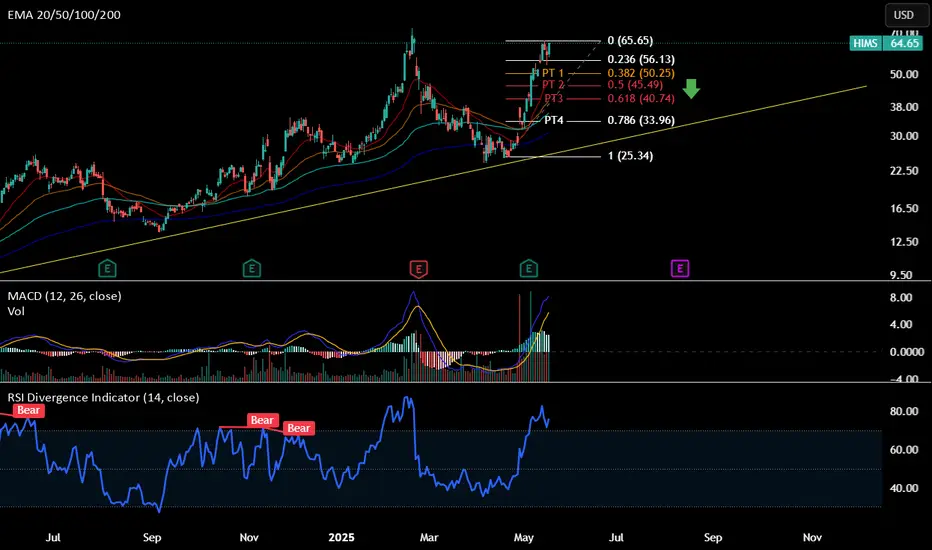
Long-term trend line: Rising trend line -> short-term bearish due to expected trend line retest (yellow trend line)
Daily MACD & RSI : Overbought -> expect a pull back
Support Line to enter PUT: ~$54
Expected time zone for pullback: 30 days to 50 days
PT1: ~50.25
PT2: ~45.49
PT3: ~40.74
PT4: ~34.96
Possible PT5: expect to cross down the EMA 200 at ~$27, which is close to the trendline support. However, I'll exit all play at PT4.
Dagangan aktif
Support line breaks -> PUT activeNota
Take profits from one time hits $54 and today at 52.5$54 is a very stubborn support
Nota
PUT option if $51 breaksStop loss: ~54
HIMS seems like it wants to retest the ATH ~72.9 as it has been accumulating for days in range 51.8 -56
Dagangan ditutup: sasaran tercapai
Nota
HIMS rejected hard at the resistance at $67-> this PUT play to reach PT 2 might be active again if it breaks support at $51.3Penafian
Maklumat dan penerbitan adalah tidak dimaksudkan untuk menjadi, dan tidak membentuk, nasihat untuk kewangan, pelaburan, perdagangan dan jenis-jenis lain atau cadangan yang dibekalkan atau disahkan oleh TradingView. Baca dengan lebih lanjut di Terma Penggunaan.
Penafian
Maklumat dan penerbitan adalah tidak dimaksudkan untuk menjadi, dan tidak membentuk, nasihat untuk kewangan, pelaburan, perdagangan dan jenis-jenis lain atau cadangan yang dibekalkan atau disahkan oleh TradingView. Baca dengan lebih lanjut di Terma Penggunaan.