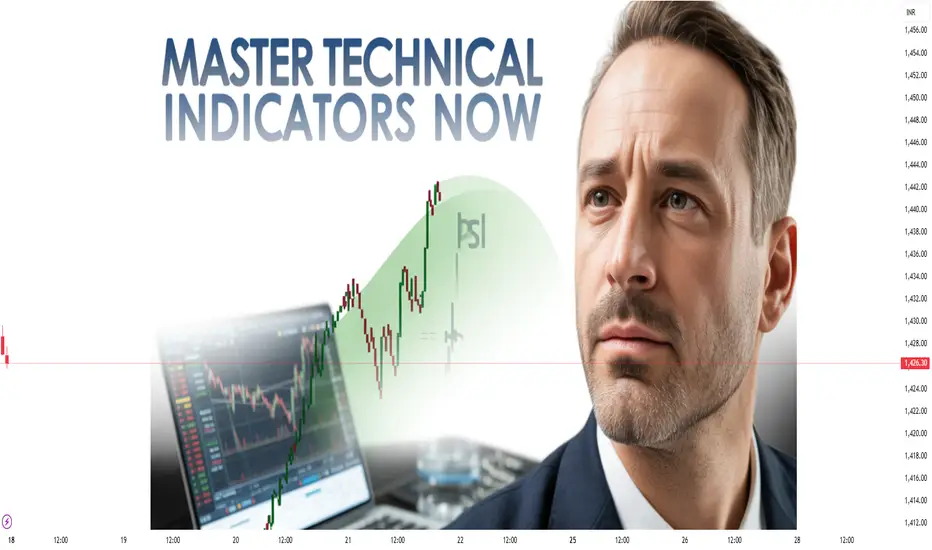
1. Introduction to Technical Indicators
In the world of financial trading, technical indicators are mathematical calculations based on historical price, volume, or open interest data. Traders use them to forecast future price movements, confirm trends, identify potential entry/exit points, and manage risk.
Technical indicators are not magic predictions—they are tools that help interpret market data and support informed decision-making. Their real value lies in:
Spotting trend direction (uptrend, downtrend, sideways)
Identifying momentum and overbought/oversold conditions
Measuring volatility for risk control
Detecting market volume shifts for confirmation
Timing entries and exits
There are hundreds of indicators, but most fall into five major categories:
Trend-following indicators (e.g., Moving Averages, MACD)
Momentum indicators (e.g., RSI, Stochastic)
Volatility indicators (e.g., Bollinger Bands, ATR)
Volume-based indicators (e.g., OBV, Volume Profile)
Market strength indicators (e.g., ADX, Aroon)
2. Understanding How Indicators Work
Every indicator is calculated using price data (open, high, low, close) and sometimes volume data. The formulas vary from simple averages to complex algorithms.
Example:
Simple Moving Average (SMA) = Sum of closing prices over n periods ÷ n
RSI = Measures the ratio of average gains to average losses over a period
They can be displayed:
Directly on the price chart (e.g., Moving Averages, Bollinger Bands)
In a separate indicator window below the chart (e.g., RSI, MACD histogram)
Key Rule: Indicators should be used in context—price action and market structure remain the foundation.
3. Trend-Following Indicators
Trend-following indicators help traders align with the market’s dominant direction rather than guessing tops and bottoms.
3.1 Moving Averages (MA)
SMA (Simple Moving Average): Smooths out price action for clearer trends.
EMA (Exponential Moving Average): Gives more weight to recent prices, reacts faster to changes.
Usage: Identify trend direction, dynamic support/resistance.
Example Strategy: Buy when price crosses above the 50 EMA, sell when it crosses below.
3.2 MACD (Moving Average Convergence Divergence)
Consists of MACD line, signal line, and histogram.
Signals:
MACD crossing above signal line = bullish
MACD crossing below signal line = bearish
Works well in trending markets but can give false signals in choppy conditions.
3.3 Parabolic SAR
Dots plotted above or below price.
Dots below price = uptrend, dots above price = downtrend.
Good for trailing stop-loss placement.
3.4 Supertrend
Combines ATR (volatility) and trend.
Turns green in bullish phase, red in bearish phase.
Often used in intraday trading for clarity.
4. Momentum Indicators
These measure the speed of price movement—helping traders catch the strongest trends and spot potential reversals.
4.1 RSI (Relative Strength Index)
Scale from 0 to 100.
Above 70 = overbought (possible reversal or pullback)
Below 30 = oversold (possible bounce)
Divergence between RSI and price can indicate trend exhaustion.
4.2 Stochastic Oscillator
Compares closing price to its price range over a set period.
%K and %D lines generate buy/sell signals via crossovers.
Effective in sideways markets for spotting turning points.
4.3 CCI (Commodity Channel Index)
Measures deviation from the average price.
Above +100 = strong bullish momentum.
Below -100 = strong bearish momentum.
4.4 Williams %R
Similar to Stochastic but inverted scale.
Ranges from 0 (overbought) to -100 (oversold).
5. Volatility Indicators
Volatility reflects market excitement or uncertainty. These indicators help with position sizing, stop placement, and detecting breakouts.
5.1 Bollinger Bands
Three lines: SMA (middle) and two bands at ± standard deviation.
Price hugging upper band = strong uptrend.
Bands squeezing together = low volatility (possible breakout).
5.2 ATR (Average True Range)
Measures average price range over a period.
Larger ATR = higher volatility.
Used to set stop-loss distances based on market conditions.
5.3 Keltner Channels
Similar to Bollinger Bands but use ATR for band width.
Better for trend-following strategies.
6. Volume-Based Indicators
Volume is the fuel of price movement—no fuel, no sustained move.
6.1 OBV (On-Balance Volume)
Cumulative volume measure that rises when price closes higher and falls when price closes lower.
Divergence from price can signal upcoming reversals.
6.2 Volume Profile
Shows volume traded at specific price levels, not time.
Helps identify high volume nodes (support/resistance) and low volume areas (potential breakout zones).
6.3 Chaikin Money Flow
Combines price and volume to measure buying/selling pressure.
7. Market Strength Indicators
These measure the underlying power of a trend.
7.1 ADX (Average Directional Index)
Scale from 0 to 100.
Above 25 = strong trend, below 20 = weak trend.
Doesn’t show direction—only strength.
7.2 Aroon Indicator
Aroon Up and Aroon Down measure time since highs/lows.
Crossovers indicate potential trend changes.
8. Combining Indicators for Better Accuracy
No single indicator is foolproof.
Traders often combine complementary indicators:
Trend + Momentum: 50 EMA + RSI
Trend + Volatility: MACD + Bollinger Bands
Volume + Price Action: Volume Profile + Price Structure
Golden Rule: Avoid indicator overload—stick to 2–3 well-chosen tools.
9. Common Mistakes with Indicators
Overfitting: Using too many indicators leading to analysis paralysis.
Lagging effect: Indicators often react after price has moved—accept this as part of trading.
Ignoring market context: Using RSI in strong trends can lead to false reversals.
No backtesting: Always test an indicator’s performance in your market/timeframe.
10. Practical Trading Strategies Using Indicators
10.1 Moving Average Crossover
Buy when 50 EMA crosses above 200 EMA (Golden Cross).
Sell when 50 EMA crosses below 200 EMA (Death Cross).
10.2 RSI Divergence
Price makes higher high, RSI makes lower high → bearish divergence.
Price makes lower low, RSI makes higher low → bullish divergence.
10.3 Bollinger Band Breakout
Wait for a squeeze → trade in direction of breakout.
Combine with volume for confirmation.
10.4 MACD Trend Following
Use MACD to ride trends, exit when histogram momentum fades.
Conclusion
Mastering technical indicators is about understanding their logic, selecting the right tools, and applying them with discipline.
Indicators don’t replace skill—they enhance it. The most successful traders combine:
Price action
Risk management
Market psychology
with carefully chosen indicators.
By practicing, backtesting, and refining, you turn indicators from mere lines on a chart into a precision decision-making toolkit.
I built a Buy & Sell Signal Indicator with 85% accuracy.
📈 Get access via DM or
WhatsApp: wa.link/d997q0
| Email: techncialexpress@gmail.com
| Script Coder | Trader | Investor | From India
📈 Get access via DM or
WhatsApp: wa.link/d997q0
| Email: techncialexpress@gmail.com
| Script Coder | Trader | Investor | From India
Penerbitan berkaitan
Penafian
Maklumat dan penerbitan adalah tidak dimaksudkan untuk menjadi, dan tidak membentuk, nasihat untuk kewangan, pelaburan, perdagangan dan jenis-jenis lain atau cadangan yang dibekalkan atau disahkan oleh TradingView. Baca dengan lebih lanjut di Terma Penggunaan.