📊 Current Snapshot
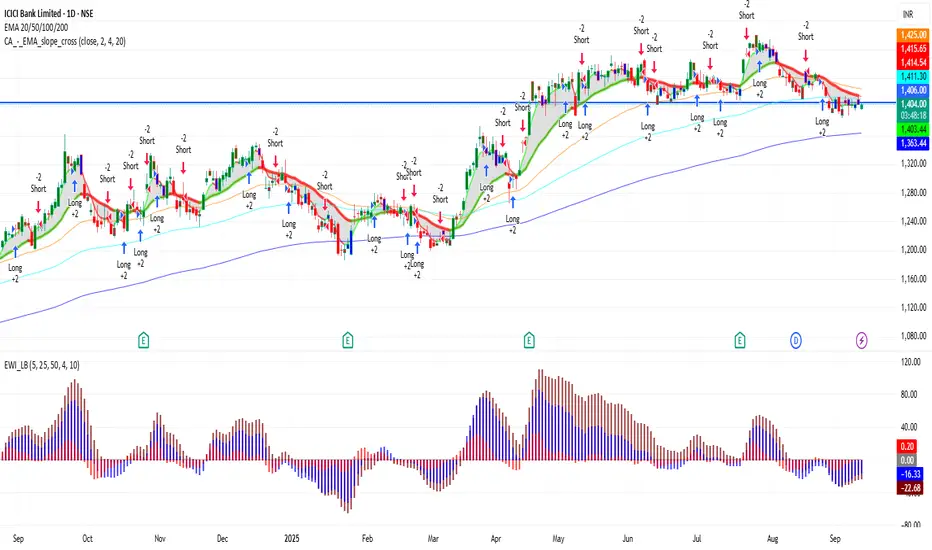
Current Price: ₹1,406.10
Day’s Range: ₹1,402.00 – ₹1,416.35
52-Week Range: ₹1,186.00 – ₹1,500.00
Previous Close: ₹1,403.90
Opening Price: ₹1,403.70
Market Cap: ₹10.02 lakh crore
Volume: ~81.3 lakh shares
📈 Trend & Indicators
Trend: Neutral to mildly bullish; trading near 50-day and 200-day moving averages.
RSI (14): 60 – Neutral; no immediate overbought or oversold conditions.
MACD: Positive → indicates bullish momentum.
Moving Averages: Short-term moving averages suggest neutral to slightly bullish outlook.
🔮 Outlook
Bullish Scenario: Break above ₹1,416 with strong volume could target ₹1,450.
Bearish Scenario: Drop below ₹1,400 may lead to further decline toward ₹1,375.
Neutral Scenario: Consolidation between ₹1,400 – ₹1,416; breakout needed for directional move.
📌 Key Factors to Watch
Market Sentiment: Overall market trend and investor behavior.
Economic Indicators: Interest rates, inflation, and RBI policy updates.
Global Cues: Global market trends, US indices, crude oil, and currency movements.
Penerbitan berkaitan
Penafian
Maklumat dan penerbitan adalah tidak bertujuan, dan tidak membentuk, nasihat atau cadangan kewangan, pelaburan, dagangan atau jenis lain yang diberikan atau disahkan oleh TradingView. Baca lebih dalam Terma Penggunaan.
Penerbitan berkaitan
Penafian
Maklumat dan penerbitan adalah tidak bertujuan, dan tidak membentuk, nasihat atau cadangan kewangan, pelaburan, dagangan atau jenis lain yang diberikan atau disahkan oleh TradingView. Baca lebih dalam Terma Penggunaan.