As of May 1, 2025, at 10:08 AM IST, ICICI Bank Ltd (NSE: ICICIBANK) is trading at ₹1,266.75. Based on recent technical analysis, here are the key support and resistance levels for the stock on a 4-hour (4H) chart:
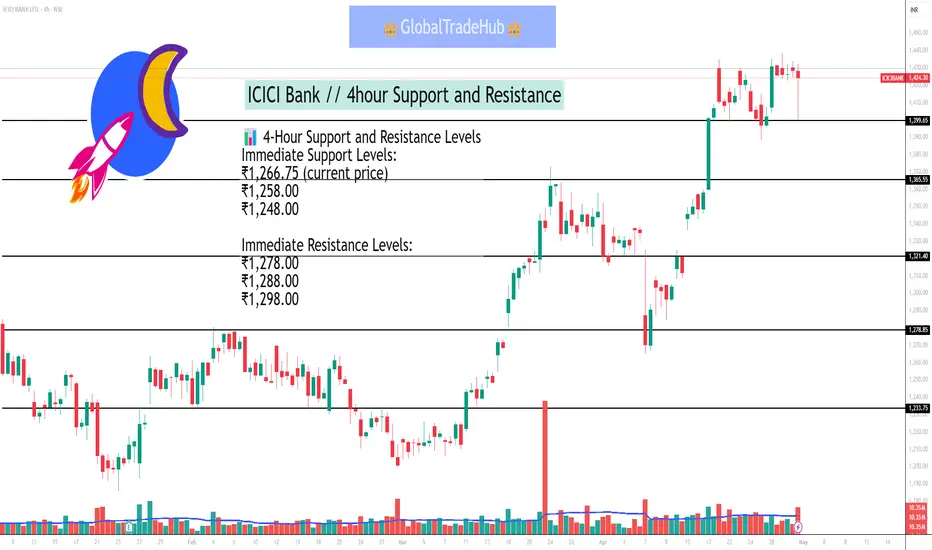
📊 4-Hour Support and Resistance Levels
Immediate Support Levels:
₹1,266.75 (current price)
₹1,258.00
₹1,248.00
Immediate Resistance Levels:
₹1,278.00
₹1,288.00
₹1,298.00
These levels suggest that if the stock price declines below ₹1,266.75, it may find support around ₹1,258.00 and ₹1,248.00. Conversely, if the price rises above ₹1,278.00, it could encounter resistance near ₹1,288.00 and ₹1,298.00.
🔍 Technical Indicators
ADX (Average Directional Index): 17.73 – indicates a weak trend.
RSI (Relative Strength Index): 55.87 – suggests neutral momentum.
MACD (Moving Average Convergence Divergence): 11.45 – indicates a positive trend.
CCI (Commodity Channel Index): 88.61 – suggests the stock is in an uptrend.
These indicators suggest a neutral to slightly bullish outlook for ICICI Bank in the short term.
Penerbitan berkaitan
Penafian
Maklumat dan penerbitan adalah tidak dimaksudkan untuk menjadi, dan tidak membentuk, nasihat untuk kewangan, pelaburan, perdagangan dan jenis-jenis lain atau cadangan yang dibekalkan atau disahkan oleh TradingView. Baca dengan lebih lanjut di Terma Penggunaan.
Penerbitan berkaitan
Penafian
Maklumat dan penerbitan adalah tidak dimaksudkan untuk menjadi, dan tidak membentuk, nasihat untuk kewangan, pelaburan, perdagangan dan jenis-jenis lain atau cadangan yang dibekalkan atau disahkan oleh TradingView. Baca dengan lebih lanjut di Terma Penggunaan.