As of May 9, 2025, ICICI Bank Ltd. (NSE: ICICIBANK) closed at ₹1,388.90. Here are the key daily support and resistance levels based on various technical analyses:
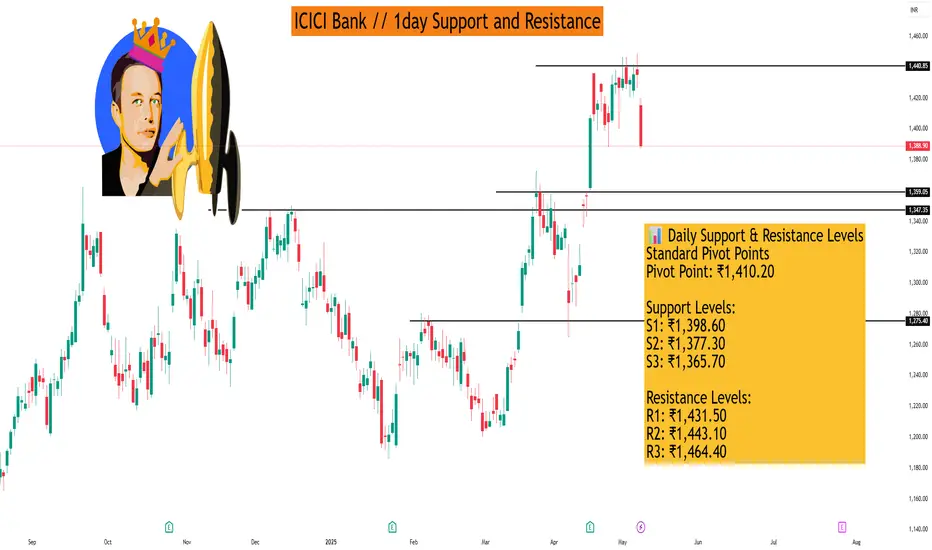
📊 Daily Support & Resistance Levels
Standard Pivot Points
Pivot Point: ₹1,410.20
Support Levels:
S1: ₹1,398.60
S2: ₹1,377.30
S3: ₹1,365.70
Resistance Levels:
R1: ₹1,431.50
R2: ₹1,443.10
R3: ₹1,464.40
Fibonacci Levels
Pivot Point: ₹1,398.60
Support Levels:
S1: ₹1,386.03
S2: ₹1,378.27
S3: ₹1,365.70
Resistance Levels:
R1: ₹1,411.17
R2: ₹1,418.93
R3: ₹1,431.50
Camarilla Levels
Support Levels:
S1: ₹1,382.87
S2: ₹1,379.85
S3: ₹1,370.81
Resistance Levels:
R1: ₹1,394.93
R2: ₹1,397.95
R3: ₹1,407.00
Woodie's Levels
Pivot Point: ₹1,405.35
Support Levels:
S1: ₹1,396.18
S2: ₹1,372.45
Resistance Levels:
R1: ₹1,429.08
R2: ₹1,438.25
Demark Levels
Support Level:
S1: ₹1,371.50
Resistance Level:
R1: ₹1,404.40
🔍 Observations
The stock is currently trading below the Standard Pivot Point of ₹1,410.20, indicating potential bearish sentiment.
Immediate support is observed around ₹1,398.60 (Standard S1) and ₹1,386.03 (Fibonacci S1).
Resistance levels to watch include ₹1,411.17 (Fibonacci R1) and ₹1,431.50 (Standard R1).
I built a Buy & Sell Signal Indicator with 85% accuracy.
📈 Get access via DM or
WhatsApp: wa.link/d997q0
| Email: techncialexpress@gmail.com
| Script Coder | Trader | Investor | From India
📈 Get access via DM or
WhatsApp: wa.link/d997q0
| Email: techncialexpress@gmail.com
| Script Coder | Trader | Investor | From India
Penerbitan berkaitan
Penafian
Maklumat dan penerbitan adalah tidak dimaksudkan untuk menjadi, dan tidak membentuk, nasihat untuk kewangan, pelaburan, perdagangan dan jenis-jenis lain atau cadangan yang dibekalkan atau disahkan oleh TradingView. Baca dengan lebih lanjut di Terma Penggunaan.