✅ Current snapshot
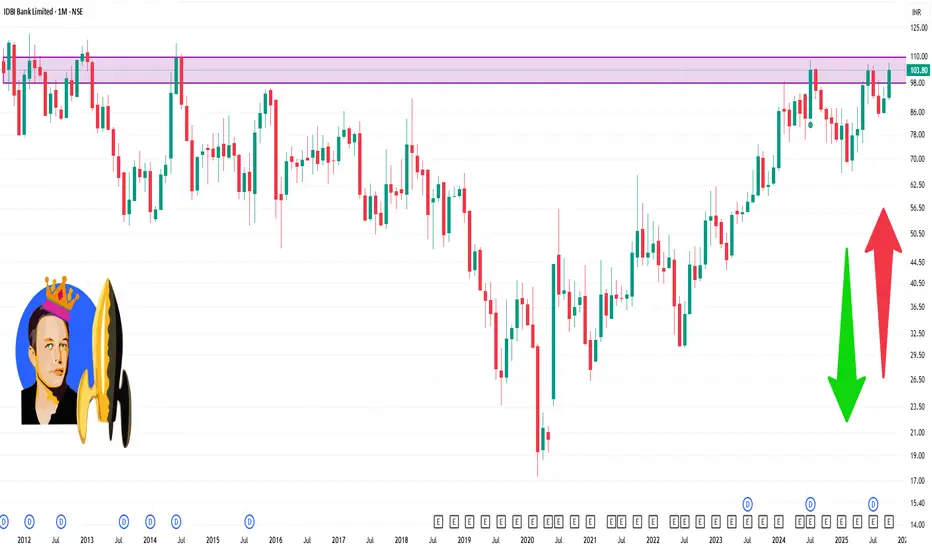
Stock is trading around ₹ 93-100 (recent levels).
52-week high ~ ₹ 106.3, 52-week low ~ ₹ 65.9.
Technical summary (monthly time-frame) shows indicators leaning “Strong Buy” overall according to one provider.
Fundamentals: P/E ~ ~10-11x, book value ~ ₹63-64 (various sources) and modest dividend yield (~2.2%).
Key development: The government + Life Insurance Corporation of India (LIC) are moving ahead with strategic changes for IDBI (which could provide medium-term tailwinds).
Penerbitan berkaitan
Penafian
The information and publications are not meant to be, and do not constitute, financial, investment, trading, or other types of advice or recommendations supplied or endorsed by TradingView. Read more in the Terms of Use.
Penerbitan berkaitan
Penafian
The information and publications are not meant to be, and do not constitute, financial, investment, trading, or other types of advice or recommendations supplied or endorsed by TradingView. Read more in the Terms of Use.