📌 Vodafone Idea (NSE: VODAFONE) – Key Levels & Market Outlook
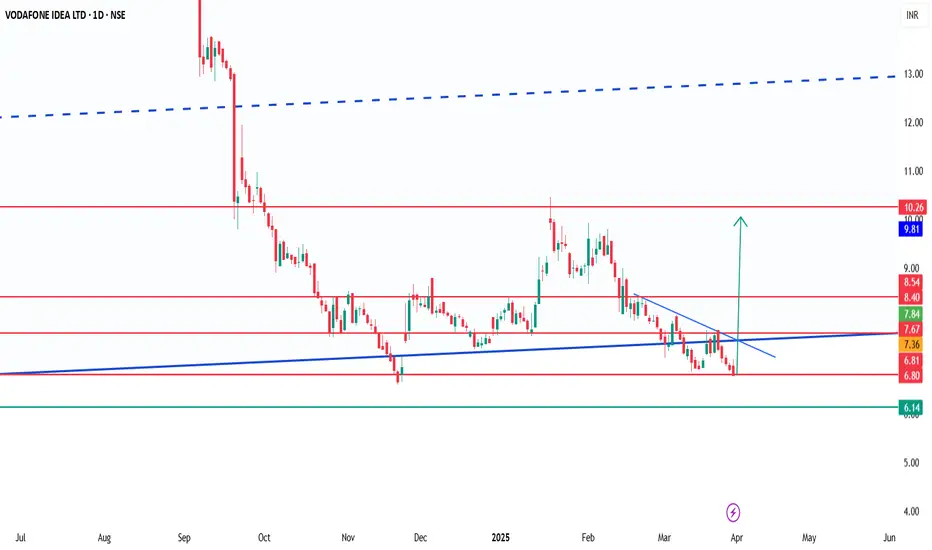
Vodafone Idea (VODAIDEA) is currently trading near a strong support level at ₹6.80. If this level holds, the stock could see a potential breakout once it crosses the ₹7-₹8 resistance zone, paving the way for an upside move toward ₹10. However, a breakdown below ₹6.80 may lead to further weakness.
🔍 Technical Indicators:
📊 Bollinger Bands: The stock is near the lower band, indicating a potential bounce if buying momentum picks up. A breakout above ₹8 could confirm strength.
📈 ADX (Average Directional Index): Currently around 20, suggesting a weak trend; a rise above 25 would confirm bullish strength.
📉 Stochastic Oscillator: Hovering near the oversold zone (below 25), signaling a possible reversal if demand increases.
📊 Volume & Open Interest: Rising volume on up-moves and increasing delivery percentage could confirm accumulation by investors.
📌 Key Levels to Watch:
✅ Support Level: ₹6.80
📍 Resistance Zone: ₹7.00-₹8.00
🚀 Upside Target: ₹10.00
⚠ Breakdown Risk: Below ₹6.80 could lead to a slide toward ₹6.50 or lower.
A decisive move above ₹8 could trigger fresh buying, pushing prices toward ₹10. However, failure to hold ₹6.80 might invite selling pressure. Keep an eye on market sentiment, telecom sector updates, and volume trends for confirmation.
Penafian
Maklumat dan penerbitan adalah tidak dimaksudkan untuk menjadi, dan tidak membentuk, nasihat untuk kewangan, pelaburan, perdagangan dan jenis-jenis lain atau cadangan yang dibekalkan atau disahkan oleh TradingView. Baca dengan lebih lanjut di Terma Penggunaan.
Penafian
Maklumat dan penerbitan adalah tidak dimaksudkan untuk menjadi, dan tidak membentuk, nasihat untuk kewangan, pelaburan, perdagangan dan jenis-jenis lain atau cadangan yang dibekalkan atau disahkan oleh TradingView. Baca dengan lebih lanjut di Terma Penggunaan.