VODAFONE IDEA LTD.
DATE - AUG 04, 2021.
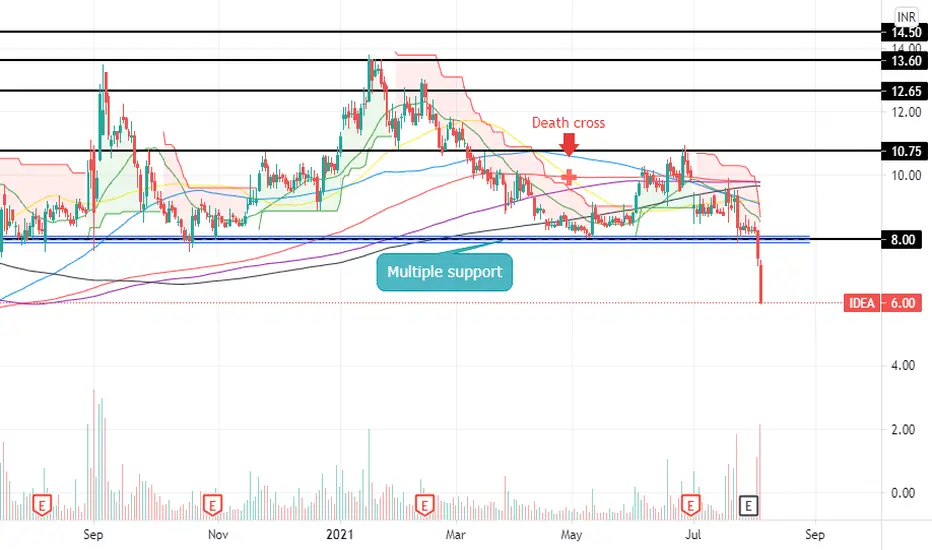
Formation of DEATH CROSS in IDEA and sharp fall in share price.
Idea breaks multiple support level.
1.The death cross is a technical chart pattern indicating the potential for a major selloff and has proven to be a reliable predictor of some of the most severe bear markets of the past century, including 1929, 1938, 1974, and 2008.
2.The death cross appears on a chart when a stock’s short-term moving average, usually the 50-day, crosses below its long-term moving average, usually the 200-day.
DATE - AUG 04, 2021.
Formation of DEATH CROSS in IDEA and sharp fall in share price.
Idea breaks multiple support level.
1.The death cross is a technical chart pattern indicating the potential for a major selloff and has proven to be a reliable predictor of some of the most severe bear markets of the past century, including 1929, 1938, 1974, and 2008.
2.The death cross appears on a chart when a stock’s short-term moving average, usually the 50-day, crosses below its long-term moving average, usually the 200-day.
Penafian
Maklumat dan penerbitan adalah tidak dimaksudkan untuk menjadi, dan tidak membentuk, nasihat untuk kewangan, pelaburan, perdagangan dan jenis-jenis lain atau cadangan yang dibekalkan atau disahkan oleh TradingView. Baca dengan lebih lanjut di Terma Penggunaan.
Penafian
Maklumat dan penerbitan adalah tidak dimaksudkan untuk menjadi, dan tidak membentuk, nasihat untuk kewangan, pelaburan, perdagangan dan jenis-jenis lain atau cadangan yang dibekalkan atau disahkan oleh TradingView. Baca dengan lebih lanjut di Terma Penggunaan.