InfoBeans Technologies – Monthly Trend Reversal + Breakout Setup | Arthavidhi Analysis
🔍 Timeframe: Monthly
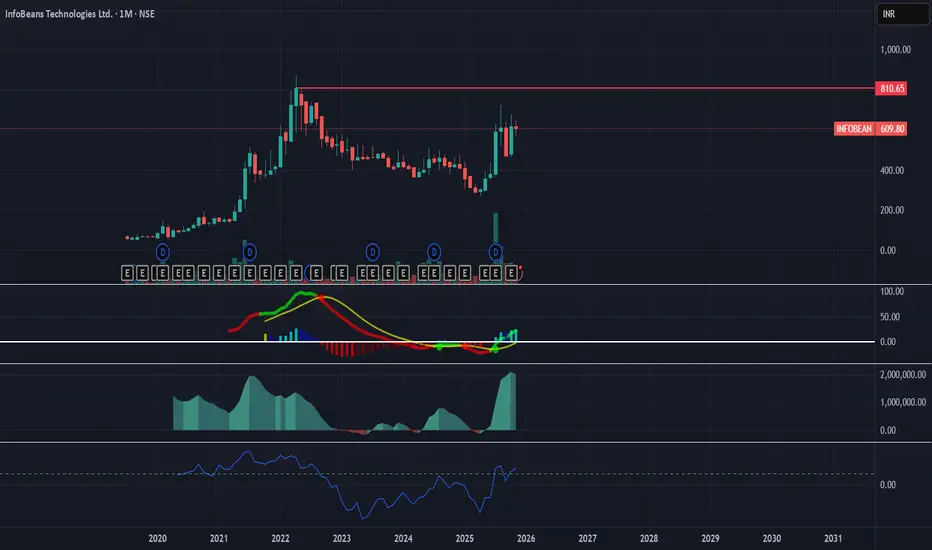
CMP: ₹609
Major Resistance: ₹810
Structure: Multi-month bottom + strong reversal
📈 Technical Overview
InfoBeans is showing a powerful bullish comeback after a deep 2-year correction.
The monthly chart indicates a classic trend reversal pattern with strong momentum confirmation.
Key Observations
✅ Massive volume spike (highest in years → fresh accumulation)
✅ MACD bullish crossover above signal + histogram expanding
✅ RSI back above 55 – entering bullish territory
✅ Strong V-shaped recovery from the bottom
✅ Monthly structure forming higher highs & higher lows
✅ Price heading toward major resistance at ₹810
This setup is ideal for a trend-restart + early breakout anticipation.
📊 Arthavidhi Trade Setup
🔹 Entry Zone
Buy between ₹595 – ₹620
Add more above ₹650 (momentum confirmation)
🔹 Stoploss (Monthly Close Basis)
₹495 (below higher-low support)
🔹 Targets
T1 → ₹720
(Near-term swing target)
T2 → ₹810
(Major breakout zone)
T3 → ₹1020
(If ₹810 breaks with volume)
T4 (Positional) → ₹1280
(Next untouched monthly resistance)
🎯 Trade Logic
Strong volume + rising MACD signals institutional buying.
Stock is in the early stage of a new uptrend.
Breaking ₹810 will activate a multi-month bullish expansion phase.
Pharma + IT midcaps often move in multi-leg rallies, supporting this structure.
⚠️ Risk Management
SL and trend invalidation only on monthly close
Risk ≤ 1–2% of portfolio
Partial booking recommended near ₹720–810
📌 Disclaimer
This analysis is an educational chart study based on the Arthavidhi trading process.
Not investment advice. #InfoBeans #INFOBEAN #MidcapIT #BreakoutTrading #TrendReversal #SwingTrading #PositionalTrade #Arthavidhi #TechnicalAnalysis #PriceAction #NSEStocks #MomentumStocks
🔍 Timeframe: Monthly
CMP: ₹609
Major Resistance: ₹810
Structure: Multi-month bottom + strong reversal
📈 Technical Overview
InfoBeans is showing a powerful bullish comeback after a deep 2-year correction.
The monthly chart indicates a classic trend reversal pattern with strong momentum confirmation.
Key Observations
✅ Massive volume spike (highest in years → fresh accumulation)
✅ MACD bullish crossover above signal + histogram expanding
✅ RSI back above 55 – entering bullish territory
✅ Strong V-shaped recovery from the bottom
✅ Monthly structure forming higher highs & higher lows
✅ Price heading toward major resistance at ₹810
This setup is ideal for a trend-restart + early breakout anticipation.
📊 Arthavidhi Trade Setup
🔹 Entry Zone
Buy between ₹595 – ₹620
Add more above ₹650 (momentum confirmation)
🔹 Stoploss (Monthly Close Basis)
₹495 (below higher-low support)
🔹 Targets
T1 → ₹720
(Near-term swing target)
T2 → ₹810
(Major breakout zone)
T3 → ₹1020
(If ₹810 breaks with volume)
T4 (Positional) → ₹1280
(Next untouched monthly resistance)
🎯 Trade Logic
Strong volume + rising MACD signals institutional buying.
Stock is in the early stage of a new uptrend.
Breaking ₹810 will activate a multi-month bullish expansion phase.
Pharma + IT midcaps often move in multi-leg rallies, supporting this structure.
⚠️ Risk Management
SL and trend invalidation only on monthly close
Risk ≤ 1–2% of portfolio
Partial booking recommended near ₹720–810
📌 Disclaimer
This analysis is an educational chart study based on the Arthavidhi trading process.
Not investment advice. #InfoBeans #INFOBEAN #MidcapIT #BreakoutTrading #TrendReversal #SwingTrading #PositionalTrade #Arthavidhi #TechnicalAnalysis #PriceAction #NSEStocks #MomentumStocks
Penafian
The information and publications are not meant to be, and do not constitute, financial, investment, trading, or other types of advice or recommendations supplied or endorsed by TradingView. Read more in the Terms of Use.
Penafian
The information and publications are not meant to be, and do not constitute, financial, investment, trading, or other types of advice or recommendations supplied or endorsed by TradingView. Read more in the Terms of Use.