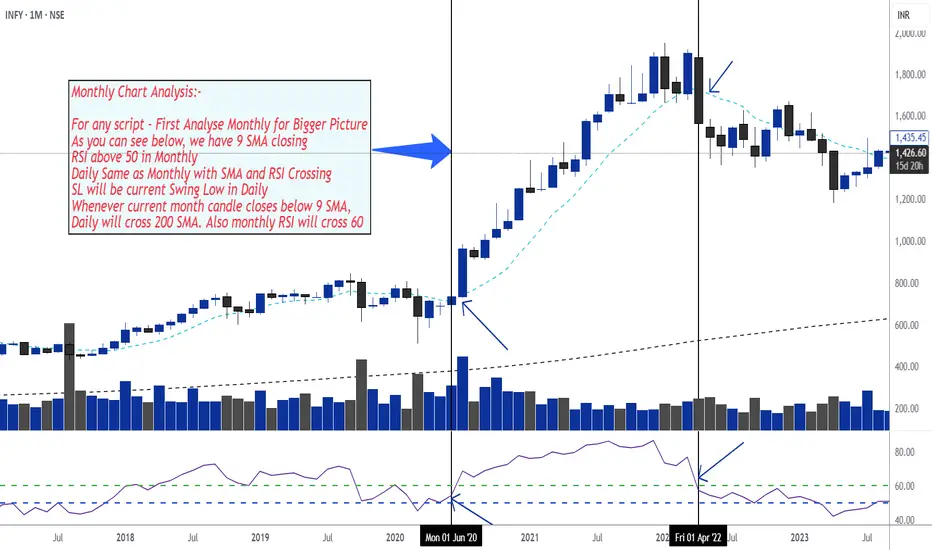
🔍 Step-by-Step Monthly Chart Analysis
1. Start with the Monthly Chart – The Bigger Picture
9 SMA (Simple Moving Average)
→ Check if the current monthly candle is closing above the 9 SMA.
This indicates a bullish trend and acts as confirmation for strength in the longer term.
RSI (Relative Strength Index)
→ RSI should be above 50.
This suggests momentum is on the bullish side.
2. Align Daily Chart with Monthly
On the daily chart, confirm the following:
Price is also closing above the 9 SMA
RSI is also above 50 and crossing upward
✅ When both monthly and daily charts are aligned with these indicators, this is a strong confirmation for entry.
3. Stop-Loss Strategy
Use the most recent swing low on the daily chart as your Stop Loss.
This keeps your risk defined and close to your entry level.
4. Exit or Red Flag Condition
If the monthly candle closes below the 9 SMA, this is your major signal to:
Watch out for a trend reversal
Expect that the daily chart might cross below the 200 SMA
Also, watch for monthly RSI potentially crossing below 60, indicating waning momentum
📌 This acts as a signal to either exit the trade or tighten your stop loss.
Penafian
Maklumat dan penerbitan adalah tidak bertujuan, dan tidak membentuk, nasihat atau cadangan kewangan, pelaburan, dagangan atau jenis lain yang diberikan atau disahkan oleh TradingView. Baca lebih dalam Terma Penggunaan.
Penafian
Maklumat dan penerbitan adalah tidak bertujuan, dan tidak membentuk, nasihat atau cadangan kewangan, pelaburan, dagangan atau jenis lain yang diberikan atau disahkan oleh TradingView. Baca lebih dalam Terma Penggunaan.