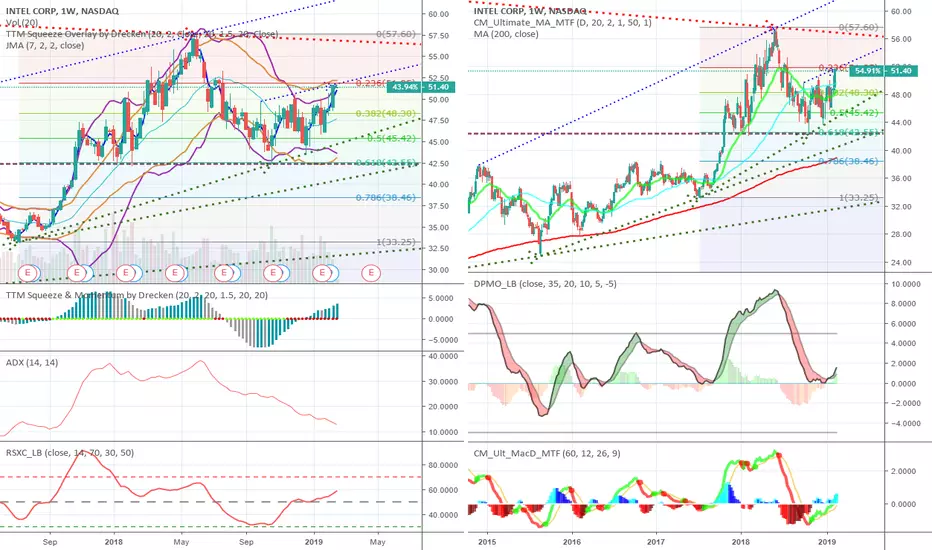
This is just a prime 1W chart. On the left, you'll see ADX in the sweet spot (sub-20), RSX above midline but not overbought and accelerating upward, TTM squeeze is on and looks primed for a massive breakout if it can clear resistance around 52. On the right, the MAs all look bullish (Green = EMA20, Turquoise = SMA50, Red = SMA200), and, perhaps most importantly for long-term signals, we've got a strong PMO crossover that started in January.
My opinion: If INTC breaks out above the downward upper resistance trendline (red), there's not much stopping it from running up to 75 and testing ATH from 2000.
My opinion: If INTC breaks out above the downward upper resistance trendline (red), there's not much stopping it from running up to 75 and testing ATH from 2000.
Nota
Here we are . . . up 14% since my post. Now, INTC has broken the downward resistance trend line. Watch for this to print 60.00 next week.
Penafian
Maklumat dan penerbitan adalah tidak dimaksudkan untuk menjadi, dan tidak membentuk, nasihat untuk kewangan, pelaburan, perdagangan dan jenis-jenis lain atau cadangan yang dibekalkan atau disahkan oleh TradingView. Baca dengan lebih lanjut di Terma Penggunaan.
Penafian
Maklumat dan penerbitan adalah tidak dimaksudkan untuk menjadi, dan tidak membentuk, nasihat untuk kewangan, pelaburan, perdagangan dan jenis-jenis lain atau cadangan yang dibekalkan atau disahkan oleh TradingView. Baca dengan lebih lanjut di Terma Penggunaan.