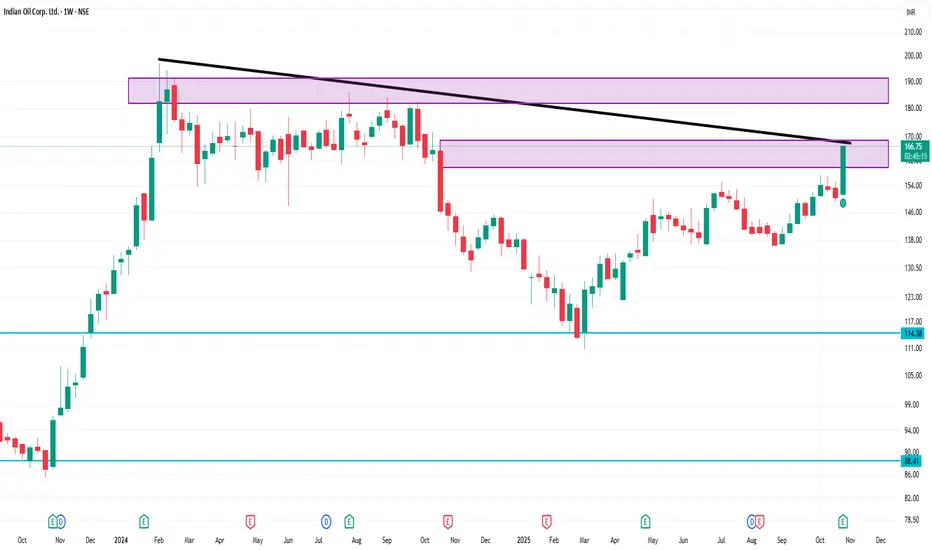
📍 Key Levels to Monitor (weekly chart)
Support zone: ~ ₹150-155. This is a region where past moving averages / consolidation occurred (also near 200-week MA).
Near-term support: ~ ₹160. If price dips, watch for reaction around this level.
Resistance / breakout area: ~ ₹166-170. Past highs / pivot region. If price convincingly breaks above this with volume, higher targets could be triggered. In the daily technicals, pivot-classic R1 ~ ₹166.54.
Next upside potential: If breakout happens, next zone maybe ~ ₹175-180 (psychological+historic highs) — but only once structure is confirmed.
Risk trigger: A close below ~ ₹150 might shift trend bias to more neutral/weak.
Penerbitan berkaitan
Penafian
Maklumat dan penerbitan adalah tidak bertujuan, dan tidak membentuk, nasihat atau cadangan kewangan, pelaburan, dagangan atau jenis lain yang diberikan atau disahkan oleh TradingView. Baca lebih dalam Terma Penggunaan.
Penerbitan berkaitan
Penafian
Maklumat dan penerbitan adalah tidak bertujuan, dan tidak membentuk, nasihat atau cadangan kewangan, pelaburan, dagangan atau jenis lain yang diberikan atau disahkan oleh TradingView. Baca lebih dalam Terma Penggunaan.