Personal thoughts, not investment advice or anything of the sort.
On the monthly we have a solid down trend and what looks like to be the beginning of a hammer candle forming for the rest of August, however when you scroll in on lower time frames, you can see that on the weekly, we were in a down trend from October of 24, making lower highs lower lows.
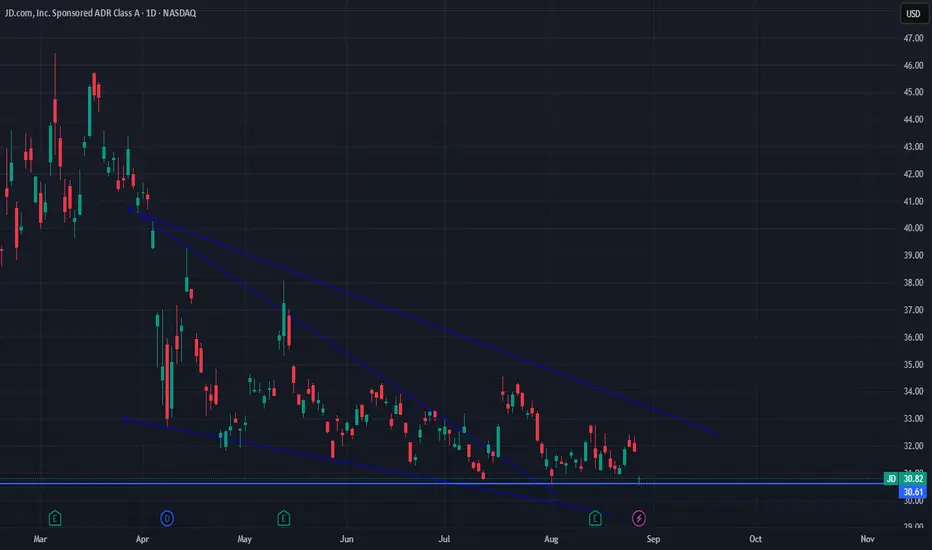
Since the down trend channel of March of 2025, we have been grinding lower the entire time, following the same downtrend since October, however you can see a huge spike before earnings came out in July of 2025, then price retraced that big buy. Do big players know something that we don't?
Scrolling in even on the daily you have a doji candle that did wick through again. However, scrolling even further down into the 1 hr, you can see that price is slightly above all 3 lows, indicating that a shake out has occurred.
If we wick lower for the rest of August, I would personally (not financial advice) cancel the trade idea.
This trade idea is very simple.
Stop loss below $30.
Target #1 $55
Target #2 $85.62
On the monthly we have a solid down trend and what looks like to be the beginning of a hammer candle forming for the rest of August, however when you scroll in on lower time frames, you can see that on the weekly, we were in a down trend from October of 24, making lower highs lower lows.
Since the down trend channel of March of 2025, we have been grinding lower the entire time, following the same downtrend since October, however you can see a huge spike before earnings came out in July of 2025, then price retraced that big buy. Do big players know something that we don't?
Scrolling in even on the daily you have a doji candle that did wick through again. However, scrolling even further down into the 1 hr, you can see that price is slightly above all 3 lows, indicating that a shake out has occurred.
If we wick lower for the rest of August, I would personally (not financial advice) cancel the trade idea.
This trade idea is very simple.
Stop loss below $30.
Target #1 $55
Target #2 $85.62
Dagangan aktif
This idea has wicked lower however the August candle was NOT a hammer candle through to the downside, thus keeping the idea valid.Penafian
Maklumat dan penerbitan adalah tidak bertujuan, dan tidak membentuk, nasihat atau cadangan kewangan, pelaburan, dagangan atau jenis lain yang diberikan atau disahkan oleh TradingView. Baca lebih dalam Terma Penggunaan.
Penafian
Maklumat dan penerbitan adalah tidak bertujuan, dan tidak membentuk, nasihat atau cadangan kewangan, pelaburan, dagangan atau jenis lain yang diberikan atau disahkan oleh TradingView. Baca lebih dalam Terma Penggunaan.