📈 Ticker:  KHC (The Kraft Heinz Company – NASDAQ)
📆 Timeframe: 1D (Daily)
💵 Current Price: $27.80
📊 Pattern: Falling Wedge Breakout + Volume & RSI Divergence
📌 Trade Setup:
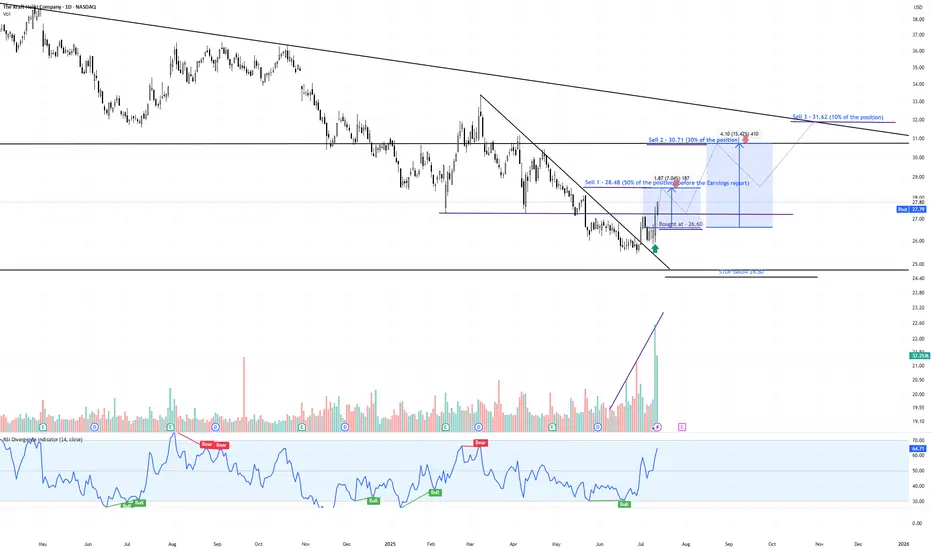
✅ Our Entry: $26.60
⛔ Stop-Loss: Below $24.80
🔰 Confirmation Signals:
Bullish volume divergence: Selling pressure diminished while price made lower lows
Explosive green volume bar on breakout — strongest in 12+ months
RSI breakout above 60, confirming strong momentum and trend shift
💰 Profit-Taking Strategy:
📍Sell Zone Price Level % of Position Rationale
🥇 Sell 1 $28.48 50% Pre-earnings resistance – lock early profit
🥈 Sell 2 $30.71 30% Next strong resistance area
🥉 Sell 3 $31.62 10% Long-term descending trendline — potential reversal point
🔄 Remaining 10%: Optional trail with stop-loss raised, if momentum continues
📊 Technical Confidence & Probabilities:
🧠 Pattern: Falling Wedge
Bulkowski probability of breakout upward: ~68%
Average gain post-breakout: ~38%, though current targets are more conservative (15–19%)
📈 Volume breakout + prior divergence = strong institutional signal
📉 Risk clearly defined with stop at $24.80
📈 Target Gains vs Entry ($26.60):
🎯 Target Price Gain from Entry
Target 1 $28.48 +7.06%
Target 2 $30.71 +15.47%
Target 3 $31.62 +18.89%
🧾 Summary:
This is a high-probability breakout play, combining:
✅ Bulkowski-validated falling wedge
✅ Volume-based confirmation
✅ Clear stop and tiered exit strategy
✅ Strong risk/reward profile
“Our Entry Price: $26.60 – Breakout Backed by Big Money”
#KHC #TargetTraders #VolumeSpike #BreakoutTrade #TechnicalAnalysis #Bulkowski #StockMarket #Investing
📆 Timeframe: 1D (Daily)
💵 Current Price: $27.80
📊 Pattern: Falling Wedge Breakout + Volume & RSI Divergence
📌 Trade Setup:
✅ Our Entry: $26.60
⛔ Stop-Loss: Below $24.80
🔰 Confirmation Signals:
Bullish volume divergence: Selling pressure diminished while price made lower lows
Explosive green volume bar on breakout — strongest in 12+ months
RSI breakout above 60, confirming strong momentum and trend shift
💰 Profit-Taking Strategy:
📍Sell Zone Price Level % of Position Rationale
🥇 Sell 1 $28.48 50% Pre-earnings resistance – lock early profit
🥈 Sell 2 $30.71 30% Next strong resistance area
🥉 Sell 3 $31.62 10% Long-term descending trendline — potential reversal point
🔄 Remaining 10%: Optional trail with stop-loss raised, if momentum continues
📊 Technical Confidence & Probabilities:
🧠 Pattern: Falling Wedge
Bulkowski probability of breakout upward: ~68%
Average gain post-breakout: ~38%, though current targets are more conservative (15–19%)
📈 Volume breakout + prior divergence = strong institutional signal
📉 Risk clearly defined with stop at $24.80
📈 Target Gains vs Entry ($26.60):
🎯 Target Price Gain from Entry
Target 1 $28.48 +7.06%
Target 2 $30.71 +15.47%
Target 3 $31.62 +18.89%
🧾 Summary:
This is a high-probability breakout play, combining:
✅ Bulkowski-validated falling wedge
✅ Volume-based confirmation
✅ Clear stop and tiered exit strategy
✅ Strong risk/reward profile
“Our Entry Price: $26.60 – Breakout Backed by Big Money”
#KHC #TargetTraders #VolumeSpike #BreakoutTrade #TechnicalAnalysis #Bulkowski #StockMarket #Investing
Penerbitan berkaitan
Penafian
Maklumat dan penerbitan adalah tidak bertujuan, dan tidak membentuk, nasihat atau cadangan kewangan, pelaburan, dagangan atau jenis lain yang diberikan atau disahkan oleh TradingView. Baca lebih dalam Terma Penggunaan.
Penerbitan berkaitan
Penafian
Maklumat dan penerbitan adalah tidak bertujuan, dan tidak membentuk, nasihat atau cadangan kewangan, pelaburan, dagangan atau jenis lain yang diberikan atau disahkan oleh TradingView. Baca lebih dalam Terma Penggunaan.