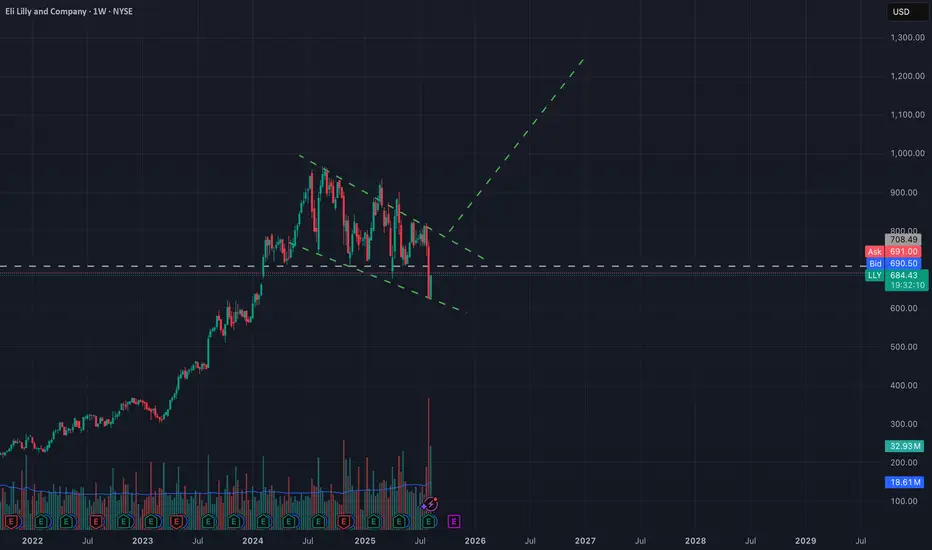
Bull flag patten on the LLY weekly Chart. The base of the flag/channel has been reactive so far although with low volume (See previously boxed LLY chart) off the top of the recent boxed range.
If you look at the previous chart, you will see that LLY is currently floating up through a low volume node on the anchored volume profile. Unless sellers step in here, 708.49/709 - 711.44 is the next target.
Volume will be in that area, if buyers step in, could be great for calls. Otherwise we could see a look above and fail of the top boxed range(again see previous chart under related publications to the right of this post).
~The Villain
Penerbitan berkaitan
Penafian
Maklumat dan penerbitan adalah tidak dimaksudkan untuk menjadi, dan tidak membentuk, nasihat untuk kewangan, pelaburan, perdagangan dan jenis-jenis lain atau cadangan yang dibekalkan atau disahkan oleh TradingView. Baca dengan lebih lanjut di Terma Penggunaan.
Penerbitan berkaitan
Penafian
Maklumat dan penerbitan adalah tidak dimaksudkan untuk menjadi, dan tidak membentuk, nasihat untuk kewangan, pelaburan, perdagangan dan jenis-jenis lain atau cadangan yang dibekalkan atau disahkan oleh TradingView. Baca dengan lebih lanjut di Terma Penggunaan.